Verizon Wireless 2014 Annual Report Download - page 65
Download and view the complete annual report
Please find page 65 of the 2014 Verizon Wireless annual report below. You can navigate through the pages in the report by either clicking on the pages listed below, or by using the keyword search tool below to find specific information within the annual report.-
 1
1 -
2
-
3
-
4
-
5
-
6
-
7
-
8
-
9
-
10
-
11
-
12
-
13
-
14
-
15
-
16
-
17
-
18
-
19
-
20
-
21
-
22
-
23
-
24
-
25
-
26
-
27
-
28
-
29
-
30
-
31
-
32
-
33
-
34
-
35
-
36
-
37
-
38
-
39
-
40
-
41
-
42
-
43
-
44
-
45
-
46
-
47
-
48
-
49
-
50
-
51
-
52
-
53
-
54
-
 55
55 -
 56
56 -
 57
57 -
 58
58 -
 59
59 -
 60
60 -
 61
61 -
 62
62 -
 63
63 -
 64
64 -
 65
65 -
 66
66 -
 67
67 -
 68
68 -
 69
69 -
 70
70 -
 71
71 -
 72
72 -
 73
73 -
 74
74 -
 75
75 -
76
-
77
-
78
-
79
-
80
 |
 |

NOTES TO CONSOLIDATED FINANCIAL STATEMENTS continued
63
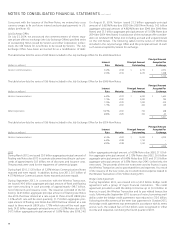
The assumed health care cost trend rates follow:
Health Care and Life
At December 31, 2014 2013 2012
Healthcare cost trend rate assumed for
next year 6.50 % 6.50 % 7.00 %
Rate to which cost trend rate gradually
declines 4.75 4.75 5.00
Year the rate reaches the level it is
assumed to remain thereafter 2022 2020 2016
A one-percentage point change in the assumed health care cost trend
rate would have the following eects:
(dollars in millions)
One-Percentage Point Increase Decrease
Eect on 2014 service and interest cost $ 193 $ (155)
Eect on postretirement benet obligation as of
December 31, 2014 3,760 (3,023)
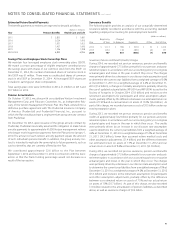
Plan Assets
The company’s overall investment strategy is to achieve a mix of assets
which allows us to meet projected benet payments while taking into
consideration risk and return. While target allocation percentages will
vary over time, the current target allocation for plan assets is designed so
that 70% of the assets have the objective of achieving a return in excess
of the growth in liabilities (comprised of public equities, private equities,
real estate, hedge funds and emerging debt) and 30% of the assets are
invested as liability hedging assets (where cash ows from investments
better match projected benet payments, typically longer duration xed
income). This allocation will shift as funded status improves to a higher
allocation of liability hedging assets. Target policies will be revisited
periodically to ensure they are in line with fund objectives. Both active
and passive management approaches are used depending on perceived
market eciencies and various other factors. Due to our diversication
and risk control processes, there are no signicant concentrations of risk,
in terms of sector, industry, geography or company names.
Pension and healthcare and life plans assets do not include signicant
amounts of Verizon common stock.
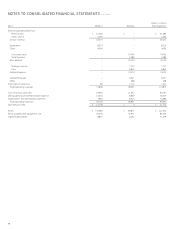
Pension Plans
The fair values for the pension plans by asset category at December 31,
2014 are as follows:
(dollars in millions)
Asset Category Total Level 1 Level 2 Level 3
Cash and cash equivalents $ 1,983 $ 1,814 $ 169 $ –
Equity securities 4,339 2,952 1,277 110
Fixed income securities
U.S. Treasuries and agencies 1,257 830 427 –
Corporate bonds 2,882 264 2,506 112
International bonds 582 39 524 19
Other 3 – 3 –
Real estate 1,792 – – 1,792
Other
Private equity 3,748 – 204 3,544
Hedge funds 1,962 – 1,164 798
Total $ 18,548 $ 5,899 $ 6,274 $ 6,375
The fair values for the pension plans by asset category at December 31,
2013 are as follows:
(dollars in millions)
Asset Category Total Level 1 Level 2 Level 3
Cash and cash equivalents $ 968 $ 881 $ 87 $ –
Equity securities 4,200 3,300 900 –
Fixed income securities
U.S. Treasuries and agencies 1,097 691 406 –
Corporate bonds 2,953 212 2,579 162
International bonds 364 51 313 –
Other 3 – 3 –
Real estate 1,784 – – 1,784
Other
Private equity 3,942 – – 3,942
Hedge funds 1,800 – 604 1,196
Total $ 17,111 $ 5,135 $ 4,892 $ 7,084