Verizon Wireless 2014 Annual Report Download - page 70
Download and view the complete annual report
Please find page 70 of the 2014 Verizon Wireless annual report below. You can navigate through the pages in the report by either clicking on the pages listed below, or by using the keyword search tool below to find specific information within the annual report.-
 1
1 -
2
-
3
-
4
-
5
-
6
-
7
-
8
-
9
-
10
-
11
-
12
-
13
-
14
-
15
-
16
-
17
-
18
-
19
-
20
-
21
-
22
-
23
-
24
-
25
-
26
-
27
-
28
-
29
-
30
-
31
-
32
-
33
-
34
-
35
-
36
-
37
-
38
-
39
-
40
-
41
-
42
-
43
-
44
-
45
-
46
-
47
-
48
-
49
-
50
-
51
-
52
-
53
-
54
-
55
-
56
-
57
-
58
-
59
-
 60
60 -
 61
61 -
 62
62 -
 63
63 -
 64
64 -
 65
65 -
 66
66 -
 67
67 -
 68
68 -
 69
69 -
 70
70 -
 71
71 -
 72
72 -
 73
73 -
 74
74 -
 75
75 -
 76
76 -
 77
77 -
 78
78 -
 79
79 -
 80
80
 |
 |

68
NOTES TO CONSOLIDATED FINANCIAL STATEMENTS continued
NOTE 14
SEGMENT INFORMATION
Reportable Segments
We have two reportable segments, which we operate and manage as
strategic business units and organize by products and services. We mea-
sure and evaluate our reportable segments based on segment operating
income, consistent with the chief operating decision maker’s assessment
of segment performance.
Corporate, eliminations and other includes unallocated corporate
expenses, intersegment eliminations recorded in consolidation, the
results of other businesses, such as our investments in unconsolidated
businesses, pension and other employee benefit related costs, lease
nancing, as well as the historical results of divested operations, other
adjustments and gains and losses that are not allocated in assessing seg-
ment performance due to their non-operational nature. Although such
transactions are excluded from the business segment results, they are
included in reported consolidated earnings. Gains and losses that are
not individually signicant are included in all segment results as these
items are included in the chief operating decision maker’s assessment of
segment performance. Eective January 1, 2014, we have also reclassied
the results of certain businesses, such as development stage businesses
that support our strategic initiatives, from our Wireline segment to
Corporate, eliminations and other. The impact of this reclassication was
not material to our consolidated nancial statements or our segment
results of operations.
On July 1, 2014, our Wireline segment sold a non-strategic business (see
Note 2). Accordingly, the historical Wireline results for these operations
have been reclassied to Corporate, eliminations and other to reect
comparable segment operating results.
The reconciliation of segment operating revenues and expenses to con-
solidated operating revenues and expenses below also includes those
items of a non-operational nature. We exclude from segment results the
eects of certain items that management does not consider in assessing
segment performance, primarily because of their non-operational nature.
We have adjusted prior period consolidated and segment information,
where applicable, to conform to current year presentation.
Our segments and their principal activities consist of the following:
Segment Description
Wireless Wireless’ communications products and services include wire-
less voice and data services and equipment sales, which are
provided to consumer, business and government customers
across the United States.
Wireline Wireline’s voice, data and video communications products and
enhanced services include broadband video and data, cor-
porate networking solutions, data center and cloud services,
security and managed network services and local and long
distance voice services. We provide these products and ser-
vices to consumers in the United States, as well as to carriers,
businesses and government customers both in the United
States and around the world.
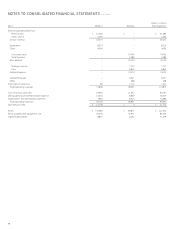
The following table provides operating nancial information for our two reportable segments:
(dollars in millions)
2014 Wireless Wireline Total Segments
External Operating Revenues
Retail service $ 69,451 $ – $ 69,451
Other service 3,104 – 3,104
Service revenue 72,555 – 72,555
Equipment 10,957 – 10,957
Other 4,021 – 4,021
Consumer retail – 15,583 15,583
Small business – 2,464 2,464
Mass Markets – 18,047 18,047
Strategic services – 8,318 8,318
Core – 5,355 5,355
Global Enterprise – 13,673 13,673
Global Wholesale – 5,240 5,240
Other – 462 462
Intersegment revenues 113 1,007 1,120
Total operating revenues 87,646 38,429 126,075
Cost of services and sales 28,825 21,332 50,157
Selling, general and administrative expense 23,602 8,180 31,782
Depreciation and amortization expense 8,459 7,882 16,341
Total operating expenses 60,886 37,394 98,280
Operating income $ 26,760 $ 1,035 $ 27,795
Assets $ 160,385 $ 76,673 $ 237,058
Plant, property and equipment, net 38,276 50,318 88,594
Capital expenditures 10,515 5,750 16,265