Verizon Wireless 2014 Annual Report Download - page 16
Download and view the complete annual report
Please find page 16 of the 2014 Verizon Wireless annual report below. You can navigate through the pages in the report by either clicking on the pages listed below, or by using the keyword search tool below to find specific information within the annual report.-
 1
1 -
2
-
3
-
4
-
5
-
 6
6 -
 7
7 -
 8
8 -
 9
9 -
 10
10 -
 11
11 -
 12
12 -
 13
13 -
 14
14 -
 15
15 -
 16
16 -
 17
17 -
 18
18 -
 19
19 -
 20
20 -
 21
21 -
 22
22 -
 23
23 -
 24
24 -
 25
25 -
 26
26 -
27
-
28
-
29
-
30
-
31
-
32
-
33
-
34
-
35
-
36
-
37
-
38
-
39
-
40
-
41
-
42
-
43
-
44
-
45
-
46
-
47
-
48
-
49
-
50
-
51
-
52
-
53
-
54
-
55
-
56
-
57
-
58
-
59
-
60
-
61
-
62
-
63
-
64
-
65
-
66
-
67
-
68
-
69
-
70
-
71
-
72
-
73
-
74
-
75
-
76
-
77
-
78
-
79
-
80
 |
 |

during 2013 compared to 2012 primarily due to an increase in our retail
postpaid connection churn rate, partially oset by an increase in retail
postpaidconnectiongrossadditions.Retailpostpaidconnectionsper
account increased as of December 31, 2013 compared to December
31, 2012 primarily due to the increased penetration of tablets and other
Internet devices.
Wireline’srevenuesdecreased$0.3billion,or0.8%,during2013com-
pared to 2012 primarily driven by declines in Global Enterprise Core
andGlobalWholesale,partiallyosetbyhigherMassMarketsrevenues
drivenbyFiOSservicesandincreasedStrategicservicesrevenueswithin
Global Enterprise.
MassMarketsrevenuesincreased$0.6billion,or3.8%,during2013com-
paredto2012duetotheexpansionofFiOSservices(Voice,Internetand
Video) as well as changes in our pricing strategies, partially oset by the
continued decline of local exchange revenues.
Global Enterprise revenues decreased $0.4 billion, or 2.7%, during 2013
compared to 2012 primarily due to a decline in Core customer premise
equipment revenues and lower voice services and data networking rev-
enues. This decrease was partially oset by growth in Strategic services
revenues, primarily due to an increase in advanced services, such as con-
tact center solutions, IP communications, and our cloud and data center
oerings as well as revenue from a telematics services business that we
acquired in the third quarter of 2012.
Global Wholesale revenues decreased $0.5 billion, or 7.0%, during 2013
compared to 2012 primarily due to a decline in traditional voice revenues
asaresultofdecreasedminutesofuse(MOUs)andadeclineindomestic
wholesale connections, partially oset by continuing demand for high-
speed digital data services from ber-to-the-cell customers upgrading
their core data circuits to Ethernet facilities as well as Ethernet migrations
from other core customers.
Other revenues decreased during 2013 compared to 2012 primarily due
to reduced volumes outside of our network footprint.
Cost of services and sales increased during 2014 compared to 2013 pri-
marily due to an increase in cost of equipment sales of $5.3 billion at our
Wireless segment as a result of an increase in the number of devices sold
as well as an increase in the cost per unit.
Selling, General and Administrative Expense
Selling, general and administrative expense includes: salaries and wages
and benets not directly attributable to a service or product, bad debt
charges, taxes other than income taxes, advertising and sales commis-
sion costs, customer billing, call center and information technology costs,
regulatory fees, professional service fees, and rent and utilities for admin-
istrative space. Also included are a portion of the aggregate customer
carecostsasdiscussedin“CostofServicesandSales”above.
14
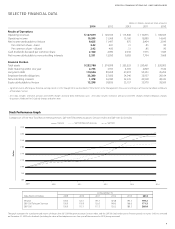
Consolidated Operating Expenses
(dollars in millions)
Increase/(Decrease)
Years Ended December 31, 2014 2013 2012 2014 vs. 2013 2013 vs. 2012
Cost of services and sales $ 49,931 $ 44,887 $ 46,275 $ 5,044 11.2 % $ (1,388) (3.0) %
Selling, general and administrative expense 41,016 27,089 39,951 13,927 51.4 (12,862) (32.2)
Depreciation and amortization expense 16,533 16,606 16,460 (73) (0.4) 146 0.9
Consolidated Operating Expenses $ 107,480 $ 88,582 $ 102,686 $ 18,898 21.3 $ (14,104) (13.7)
MassMarketsrevenuesincreased$0.7billion,or3.8%,during2014com-
paredto2013primarilyduetotheexpansionofFiOSservices(Voice,
InternetandVideo),includingourFiOSQuantumoerings,aswellas
changes in our pricing strategies, partially oset by the continued decline
of local exchange revenues.
Global Enterprise revenues decreased $0.5 billion, or 3.5%, during 2014
compared to 2013 primarily due to lower voice services and data net-
working revenues, the contraction of market rates due to competition
and a decline in Core customer premise equipment revenues. This
decrease was partially oset by an increase in Strategic services revenues,
primarily due to growth in our application services, such as our cloud and
data center oerings and contact center solutions.
Global Wholesale revenues decreased $0.4 billion, or 5.6%, during 2014
compared to 2013 primarily due to a decline in data revenues driven by
the continuing demand for high-speed digital data services from ber-to-
the-cell customers upgrading their core data circuits to Ethernet facilities,
as well as a decline in traditional voice revenues. During 2014, we also
experienced a decline in domestic wholesale connections.
2013 Compared to 2012
The increase in consolidated revenues during 2013 compared to 2012
wasprimarilyduetohigherrevenuesatWireless,aswellashigherMass
MarketsrevenuesdrivenbyFiOSservicesandincreasedStrategicser-
vices revenues within Global Enterprise at our Wireline segment. Partially
osetting these increases were lower Global Enterprise Core and Global
Wholesale revenues at our Wireline segment.
Wireless’revenuesincreased$5.2billion,or6.8%,during2013compared
to 2012 due to growth in service revenue. Service revenue increased
during 2013 compared to 2012 primarily driven by higher retail postpaid
service revenue, which increased largely as a result of an increase in retail
postpaid connections as well as the continued increase in penetration
of smartphones, tablets and other Internet devices through our Share
Everythingplans.Retailpostpaidconnectionnetadditionsdecreased
2014 Compared to 2013
Cost of Services and Sales
Cost of services and sales includes the following costs directly attrib-
utable to a service or product: salaries and wages, benets, materials
and supplies, content costs, contracted services, network access and
transport costs, wireless equipment costs, customer provisioning costs,
computer systems support, costs to support our outsourcing contracts
andtechnicalfacilitiesandcontributionstotheUniversalServiceFund.
Aggregate customer care costs, which include billing and service pro-
visioning, are allocated between Cost of services and sales and Selling,
general and administrative expense.
MANAGEMENT’S DISCUSSION AND ANALYSIS
OF FINANCIAL CONDITION AND RESULTS OF OPERATIONS continued
Consolidated operating expenses increased during 2014 primarily due to non-operational charges recorded in 2014 as compared to non-operational
creditsrecordedin2013(see“OtherItems”)aswellasincreasedoperatingexpensesatWireless.Consolidatedoperatingexpensesdecreasedduring
2013primarilyduetonon-operationalcreditsrecordedin2013ascomparedtonon-operationalchargesrecordedin2012(see“OtherItems”).