Verizon Wireless 2014 Annual Report Download - page 25
Download and view the complete annual report
Please find page 25 of the 2014 Verizon Wireless annual report below. You can navigate through the pages in the report by either clicking on the pages listed below, or by using the keyword search tool below to find specific information within the annual report.-
 1
1 -
2
-
3
-
4
-
5
-
6
-
7
-
8
-
9
-
10
-
11
-
12
-
13
-
14
-
 15
15 -
 16
16 -
 17
17 -
 18
18 -
 19
19 -
 20
20 -
 21
21 -
 22
22 -
 23
23 -
 24
24 -
 25
25 -
 26
26 -
 27
27 -
 28
28 -
 29
29 -
 30
30 -
 31
31 -
 32
32 -
 33
33 -
 34
34 -
 35
35 -
36
-
37
-
38
-
39
-
40
-
41
-
42
-
43
-
44
-
45
-
46
-
47
-
48
-
49
-
50
-
51
-
52
-
53
-
54
-
55
-
56
-
57
-
58
-
59
-
60
-
61
-
62
-
63
-
64
-
65
-
66
-
67
-
68
-
69
-
70
-
71
-
72
-
73
-
74
-
75
-
76
-
77
-
78
-
79
-
80
 |
 |

23
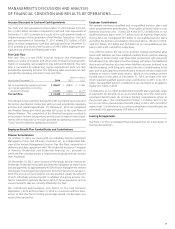
Selling, General and Administrative Expense
Selling, general and administrative expense decreased during 2014 com-
pared to 2013 primarily due to declines in employee costs as a result of
reduced headcount, decreased advertising expense and lower transac-
tion and property taxes.
Selling, general and administrative expense decreased during 2013 com-
pared to 2012 primarily due to declines in employee costs, primarily as
a result of reduced headcount, and declines in rent expenses, partially
oset by higher transaction and property tax expenses.
Depreciation and Amortization Expense
Depreciation and amortization expense decreased during 2014 com-
pared to 2013, as well as 2013 compared to 2012, due to decreases in net
depreciable assets.
Non-operationalitemsexcludedfromWireline’sOperatingincomewere
as follows:
(dollars in millions)
Years Ended December 31, 2014 2013 2012
Severance, pension and benet charges $ 189 $ – $ –
Impact of divested operations (12) (43) (56)
Other costs 137 – 56
$ 314 $ (43) $ –
Cost of Services and Sales
Cost of services and sales decreased slightly during 2014 compared
to 2013, primarily due to a decrease in employee costs as a result of
reduced headcount and a decline in access costs driven by declines in
overall wholesale long distance volumes, which was partially oset by an
increaseincontentcostsof$0.4billionassociatedwithcontinuedFiOS
subscriber growth and programming license fee increases.
Cost of services and sales decreased during 2013 compared to 2012, pri-
marily due to a decrease in costs related to customer premise equipment
which reected our focus on improving margins by de-emphasizing sales
of equipment that are not part of an overall enterprise solutions bundle, a
decline in access costs resulting primarily from declines in overall whole-
sale long distance volumes and the net eect of storm-related insurance
recoveries. These decreases were partially oset by higher content costs
associatedwithcontinuedFiOSsubscribergrowthandprogramming
license fee increases.
The changes inWireline’s Operating income, Segment EBITDA and
Segment EBITDA margin during the periods presented were primarily
a result of the factors described in connection with operating revenues
and operating expenses.
Operating Expenses (dollars in millions)
Increase/(Decrease)
Years Ended December 31, 2014 2013 2012 2014 vs. 2013 2013 vs. 2012
Cost of services and sales $ 21,332 $ 21,396 $ 21,657 $ (64) (0.3)% $ (261) (1.2) %
Selling, general and administrative expense 8,180 8,571 8,860 (391) (4.6) (289) (3.3)
Depreciation and amortization expense 7,882 8,327 8,424 (445) (5.3) (97) (1.2)
Total Operating Expenses $ 37,394 $ 38,294 $ 38,941 $ (900) (2.4) $ (647) (1.7)
Segment Operating Income and EBITDA (dollars in millions)
Increase/(Decrease)
Years Ended December 31, 2014 2013 2012 2014 vs. 2013 2013 vs. 2012
Segment Operating Income $ 1,035 $ 330 $ 4 $ 705 nm $ 326 nm
Add Depreciation and amortization expense 7,882 8,327 8,424 (445) (5.3)% (97) (1.2)%
Segment EBITDA $ 8,917 $ 8,657 $ 8,428 $ 260 3.0 $ 229 2.7
Segment operating income margin 2.7% 0.9% –
Segment EBITDA margin 23.2% 22.4% 21.6%
nm - not meaningful
MANAGEMENT’S DISCUSSION AND ANALYSIS
OF FINANCIAL CONDITION AND RESULTS OF OPERATIONS continued