Verizon Wireless 2014 Annual Report Download - page 71
Download and view the complete annual report
Please find page 71 of the 2014 Verizon Wireless annual report below. You can navigate through the pages in the report by either clicking on the pages listed below, or by using the keyword search tool below to find specific information within the annual report.-
 1
1 -
2
-
3
-
4
-
5
-
6
-
7
-
8
-
9
-
10
-
11
-
12
-
13
-
14
-
15
-
16
-
17
-
18
-
19
-
20
-
21
-
22
-
23
-
24
-
25
-
26
-
27
-
28
-
29
-
30
-
31
-
32
-
33
-
34
-
35
-
36
-
37
-
38
-
39
-
40
-
41
-
42
-
43
-
44
-
45
-
46
-
47
-
48
-
49
-
50
-
51
-
52
-
53
-
54
-
55
-
56
-
57
-
58
-
59
-
60
-
 61
61 -
 62
62 -
 63
63 -
 64
64 -
 65
65 -
 66
66 -
 67
67 -
 68
68 -
 69
69 -
 70
70 -
 71
71 -
 72
72 -
 73
73 -
 74
74 -
 75
75 -
 76
76 -
 77
77 -
 78
78 -
 79
79 -
 80
80
 |
 |

69
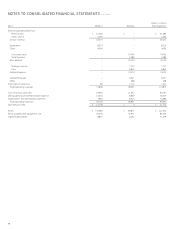
NOTES TO CONSOLIDATED FINANCIAL STATEMENTS continued
(dollars in millions)
2013 Wireless Wireline Total Segments
External Operating Revenues
Retail service $ 66,282 $ – $ 66,282
Other service 2,691 – 2,691
Service revenue 68,973 – 68,973
Equipment 8,096 – 8,096
Other 3,851 – 3,851
Consumer retail – 14,842 14,842
Small business – 2,537 2,537
Mass Markets – 17,379 17,379
Strategic services – 8,129 8,129
Core – 6,028 6,028
Global Enterprise – 14,157 14,157
Global Wholesale – 5,583 5,583
Other – 442 442
Intersegment revenues 103 1,063 1,166
Total operating revenues 81,023 38,624 119,647
Cost of services and sales 23,648 21,396 45,044
Selling, general and administrative expense 23,176 8,571 31,747
Depreciation and amortization expense 8,202 8,327 16,529
Total operating expenses 55,026 38,294 93,320
Operating income $ 25,997 $ 330 $ 26,327
Assets $ 146,429 $ 84,573 $ 231,002
Plant, property and equipment, net 35,932 51,885 87,817
Capital expenditures 9,425 6,229 15,654