Verizon Wireless 2014 Annual Report Download - page 72
Download and view the complete annual report
Please find page 72 of the 2014 Verizon Wireless annual report below. You can navigate through the pages in the report by either clicking on the pages listed below, or by using the keyword search tool below to find specific information within the annual report.-
 1
1 -
2
-
3
-
4
-
5
-
6
-
7
-
8
-
9
-
10
-
11
-
12
-
13
-
14
-
15
-
16
-
17
-
18
-
19
-
20
-
21
-
22
-
23
-
24
-
25
-
26
-
27
-
28
-
29
-
30
-
31
-
32
-
33
-
34
-
35
-
36
-
37
-
38
-
39
-
40
-
41
-
42
-
43
-
44
-
45
-
46
-
47
-
48
-
49
-
50
-
51
-
52
-
53
-
54
-
55
-
56
-
57
-
58
-
59
-
60
-
61
-
 62
62 -
 63
63 -
 64
64 -
 65
65 -
 66
66 -
 67
67 -
 68
68 -
 69
69 -
 70
70 -
 71
71 -
 72
72 -
 73
73 -
 74
74 -
 75
75 -
 76
76 -
 77
77 -
 78
78 -
 79
79 -
 80
80
 |
 |

70
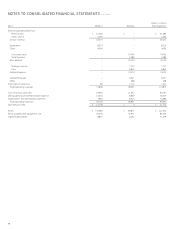
NOTES TO CONSOLIDATED FINANCIAL STATEMENTS continued
(dollars in millions)
2012 Wireless Wireline Total Segments
External Operating Revenues
Retail service $ 61,383 $ – $ 61,383
Other service 2,290 – 2,290
Service revenue 63,673 – 63,673
Equipment 8,010 – 8,010
Other 4,096 – 4,096
Consumer retail – 14,145 14,145
Small business – 2,589 2,589
Mass Markets – 16,734 16,734
Strategic services – 7,737 7,737
Core – 6,833 6,833
Global Enterprise – 14,570 14,570
Global Wholesale – 6,031 6,031
Other – 498 498
Intersegment revenues 89 1,112 1,201
Total operating revenues 75,868 38,945 114,813
Cost of services and sales 24,490 21,657 46,147
Selling, general and administrative expense 21,650 8,860 30,510
Depreciation and amortization expense 7,960 8,424 16,384
Total operating expenses 54,100 38,941 93,041
Operating income $ 21,768 $ 4 $ 21,772
Assets $ 142,485 $ 84,815 $ 227,300
Plant, property and equipment, net 34,545 52,911 87,456
Capital expenditures 8,857 6,342 15,199