Verizon Wireless 2014 Annual Report Download - page 15
Download and view the complete annual report
Please find page 15 of the 2014 Verizon Wireless annual report below. You can navigate through the pages in the report by either clicking on the pages listed below, or by using the keyword search tool below to find specific information within the annual report.-
 1
1 -
2
-
3
-
4
-
 5
5 -
 6
6 -
 7
7 -
 8
8 -
 9
9 -
 10
10 -
 11
11 -
 12
12 -
 13
13 -
 14
14 -
 15
15 -
 16
16 -
 17
17 -
 18
18 -
 19
19 -
 20
20 -
 21
21 -
 22
22 -
 23
23 -
 24
24 -
 25
25 -
26
-
27
-
28
-
29
-
30
-
31
-
32
-
33
-
34
-
35
-
36
-
37
-
38
-
39
-
40
-
41
-
42
-
43
-
44
-
45
-
46
-
47
-
48
-
49
-
50
-
51
-
52
-
53
-
54
-
55
-
56
-
57
-
58
-
59
-
60
-
61
-
62
-
63
-
64
-
65
-
66
-
67
-
68
-
69
-
70
-
71
-
72
-
73
-
74
-
75
-
76
-
77
-
78
-
79
-
80
 |
 |

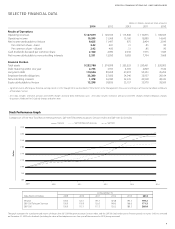
Consolidated Revenues
(dollars in millions)
Increase/(Decrease)
Years Ended December 31, 2014 2013 2012 2014 vs. 2013 2013 vs. 2012
Wireless
Service revenue $ 72,630 $ 69,033 $ 63,733 $ 3,597 5.2 % $ 5,300 8.3 %
Equipment and other 15,016 11,990 12,135 3,026 25.2 (145) (1.2)
Total 87,646 81,023 75,868 6,623 8.2 5,155 6.8
Wireline
MassMarkets 18,047 17,383 16,746 664 3.8 637 3.8
Global Enterprise 13,684 14,182 14,577 (498) (3.5) (395) (2.7)
Global Wholesale 6,222 6,594 7,094 (372) (5.6) (500) (7.0)
Other 476 465 528 11 2.4 (63) (11.9)
Total 38,429 38,624 38,945 (195) (0.5) (321) (0.8)
Corporate, eliminations and other 1,004 903 1,033 101 11.2 (130) (12.6)
Consolidated Revenues $ 127,079 $ 120,550 $ 115,846 $ 6,529 5.4 $ 4,704 4.1
plans. Equipment and other revenue increased during 2014 compared
to 2013 primarily due to an increase in equipment sales under both the
traditionalsubsidymodelandVerizonEdge.Retailpostpaidconnection
net additions increased during 2014 compared to 2013 primarily due to
an increase in retail postpaid connection gross additions partially oset
by an increase in our retail postpaid connection churn rate. Retail
postpaid connections per account increased as of December 31, 2014
compared to December 31, 2013 primarily due to the increased penetra-
tion of tablets.
Wireline’srevenuesdecreased$0.2billion,or0.5%,during2014com-
pared to 2013 primarily as a result of declines in Global Enterprise Core
andGlobalWholesale,partiallyosetbyhigherMassMarketsrevenues
drivenbyFiOSservicesandincreasedStrategicservicesrevenueswithin
Global Enterprise.
13
MANAGEMENT’S DISCUSSION AND ANALYSIS
OF FINANCIAL CONDITION AND RESULTS OF OPERATIONS continued
2014 Compared to 2013
The increase in consolidated revenues during 2014 compared to 2013
wasprimarilyduetohigherrevenuesatWireless,aswellashigherMass
Markets revenues driven by FiOS services at ourWireline segment.
Partially osetting these increases were lower Global Enterprise Core and
Global Wholesale revenues at our Wireline segment.
Wireless’revenuesincreased$6.6billion,or8.2%,during2014compared
to 2013 primarily as a result of growth in service revenue and equip-
ment revenue. The increase in service revenue, which does not include
recurring equipment installment billings related to Verizon Edge, during
2014 compared to 2013 was primarily driven by higher retail postpaid
service revenue, which increased largely as a result of an increase in
retail postpaid connections as well as the continued increase in penetra-
tionof4GLTEsmartphonesandtabletsthroughourMoreEverything
CONSOLIDATED RESULTS OF OPERATIONS
In this section, we discuss our overall results of operations and highlight items of a non-operational nature that are not included in our segment
results. We have two reportable segments, Wireless and Wireline, which we operate and manage as strategic business units and organize by products
andservices.In“SegmentResultsofOperations,”wereviewtheperformanceofourtworeportablesegments.
OnFebruary21,2014,wecompletedtheacquisitionofVodafone’sindirect45%interestinVerizonWireless.Asaresult,ourresultsreectour55%
ownership of Verizon Wireless through the closing of the Wireless Transaction and reect our full ownership of Verizon Wireless from the closing of the
Wireless Transaction through December 31, 2014.
Corporate, eliminations and other includes unallocated corporate expenses such as certain pension and other employee benet related costs,
intersegment eliminations recorded in consolidation, the results of other businesses, such as our investments in unconsolidated businesses, lease
nancing as well as the historical results of divested operations, other adjustments and gains and losses that are not allocated in assessing segment
performance due to their non-operational nature. Although such transactions are excluded from the business segment results, they are included in
reported consolidated earnings. Gains and losses that are not individually signicant are included in all segment results as these items are included in
thechiefoperatingdecisionmaker’sassessmentofsegmentperformance.Webelievethatthispresentationassistsusersofournancialstatements
in better understanding our results of operations and trends from period to period. Eective January 1, 2014, we have also reclassied the results of
certain businesses, such as development stage businesses that support our strategic initiatives, from our Wireline segment to Corporate, eliminations
and other. The impact of this reclassication was not material to our consolidated nancial statements or our segment results of operations.
OnJuly1,2014,ourWirelinesegmentsoldanon-strategicbusiness(see“AcquisitionsandDivestitures”).Accordingly,thehistoricalWirelineresultsfor
these operations, which were not material to our consolidated nancial statements or our segment results of operations, have been reclassied to
Corporate, eliminations and other to reect comparable segment operating results. The results of operations related to this divestiture included within
Corporate, eliminations and other are as follows:
(dollars in millions)
Years Ended December 31, 2014 2013 2012
Impact of Divested Operations
Operating revenues $ 256 $ 599 $ 835
Cost of services and sales 239 531 756
Selling, general and administrative expense 5 25 23