American Airlines 1997 Annual Report Download - page 3
Download and view the complete annual report
Please find page 3 of the 1997 American Airlines annual report below. You can navigate through the pages in the report by either clicking on the pages listed below, or by using the keyword search tool below to find specific information within the annual report.-
 1
1 -
 2
2 -
 3
3 -
 4
4 -
 5
5 -
 6
6 -
 7
7 -
 8
8 -
 9
9 -
 10
10 -
 11
11 -
 12
12 -
 13
13 -
 14
14 -
15
-
16
-
17
-
18
-
19
-
20
-
21
-
22
-
23
-
24
-
25
-
26
-
27
-
28
-
29
-
30
-
31
-
32
-
33
-
34
-
35
-
36
-
37
-
38
-
39
-
40
-
41
-
42
-
43
-
44
-
45
-
46
-
47
-
48
-
49
-
50
-
51
-
52
-
53
-
54
-
55
-
56
-
57
-
58
-
59
-
60
-
61
-
62
-
63
-
64
-
65
-
66
-
67
-
68
-
69
-
70
-
71
-
72
-
73
-
74
-
75
-
76
 |
 |

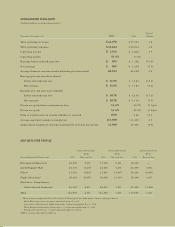
CONSOLI DATED HI GHLI GHTS
(Dollars in millions, except per share amounts)
Percent
Year ended December 31, 1997 1996 Change
Total operating revenues $18,570 $17,753 4.6
Total operating expenses $16,644 $15,914 4.6
Operating income $1,926 $1,839 4.7
Operating margin 10.4% 10.4% -
Earnings before extraordinary loss $985 $1,105 (10.9)
Net earnings $985 $1,016 (3.1)
Average shares of common stock outstanding (in thousands) 89,152 86,092 3.6
Earnings per common share (basic)
Before extraordinary loss $11.05 $12.83 (13.9)
Net earnings $11.05 $11.80 (6.4)
Earnings per common share (diluted)
Before extraordinary loss $10.78 $12.15 (11.3)
Net earnings $10.78 $11.19 (3.7)
Return on equity before extraordinary loss 16.6% 23.7% (7.1)pts.
Return on equity 16.6% 21.8% (5.2)pts.
Ratio of current assets to current liabilities at year-end 0.90 0.80 12.5
Average equivalent number of employees 113,900 111,300 2.3
Approximate number of common shareholders of record at year-end 14,300 15,300 (6.5)
AM R EM PLOYEE PROFILE
Increase/(Decrease) Increase/(Decrease) Increase/(Decrease)
From From From
Average Equivalent Headcount 1997 Previous Year 1996 Previous Year 1995 Previous Year
Management/Specialist 18,300 7.0% 17,100 5.6% 16,200 —
Agent/Support Staff 32,100 (1.2)% 32,500 2.2% 31,800 4.6%
Pilots* 11,000 (1.8)% 11,200 (1.8)% 11,400 (5.8)%
Flight Attendants* 18,400 (0.5)% 18,500 (3.1)% 19,100 0.5%
Mechanics, Ramp Service,
Other Ground Personnel* 34,100 6.6% 32,000 1.6% 31,500 (1.9)%
Total 113,900 2.3% 111,300 1.2% 110,000 0.2%
* The majority are represented by a labor union. Following is a list of the status of major existing contracts:
Allied Pilots Association. Contract amendable Aug. 31, 2001.
Association of Professional Flight Attendants. Contract amendable Nov. 1, 1998.
Flight Engineers International Association. Contract amendable Aug. 31, 2001.
Transport Workers Union. Contract amendable March 1, 2001.
AMR is an equal opportunity employer.