American Airlines 1997 Annual Report Download - page 38
Download and view the complete annual report
Please find page 38 of the 1997 American Airlines annual report below. You can navigate through the pages in the report by either clicking on the pages listed below, or by using the keyword search tool below to find specific information within the annual report.-
 1
1 -
2
-
3
-
4
-
5
-
6
-
7
-
8
-
9
-
10
-
11
-
12
-
13
-
14
-
15
-
16
-
17
-
18
-
19
-
20
-
21
-
22
-
23
-
24
-
25
-
26
-
27
-
 28
28 -
 29
29 -
 30
30 -
 31
31 -
 32
32 -
 33
33 -
 34
34 -
 35
35 -
 36
36 -
 37
37 -
 38
38 -
 39
39 -
 40
40 -
 41
41 -
 42
42 -
 43
43 -
 44
44 -
 45
45 -
 46
46 -
 47
47 -
 48
48 -
49
-
50
-
51
-
52
-
53
-
54
-
55
-
56
-
57
-
58
-
59
-
60
-
61
-
62
-
63
-
64
-
65
-
66
-
67
-
68
-
69
-
70
-
71
-
72
-
73
-
74
-
75
-
76
 |
 |

AMR CORPORATION
36
Pilots Association (APA) during the first quarter of 1997,
which negatively impacted the Company’s net earnings
by an estimated $70 million, and the reinstatement of the
airline transportation tax in March of 1997.
AMR’s net earnings in 1996 were $1.0 billion, or
$11.80 per common share ($11.19 diluted). In the fourth
quarter of 1996, the Company recorded a $497 million
gain related to the initial public offering of The SABRE
Group and a $251 million charge ($230 million after tax)
associated with the Company’s relationship with Canadi-
an Airlines International Limited (Canadian). AMR also
recorded a $26 million charge ($16 million after tax) in
the fourth quarter of 1996 to write down the value of air-
craft interiors the Company planned to refurbish. To
reduce interest expense, the Company repurchased
and/or retired prior to scheduled maturity approximately
$1.1 billion in face value of long-term debt and capital
lease obligations. These long-term debt and capital lease
transactions resulted in an extraordinary loss of $136
million ($89 million after tax) in 1996. Excluding these
special items, totaling $162 million after tax, net earnings
were $854 million.
Business Segments The SABRE Group has significant
transactions with American and the Airline Group. In the
second quarter of 1996, American and The SABRE Group
completed the negotiation of a new technology services
agreement pursuant to which The SABRE Group per-
forms data processing and solutions services for Ameri-
can. This agreement reflected the downward trend in
market prices for data processing services. Additionally,
the two companies completed negotiations on new agree-
ments covering the provision of air travel and certain
marketing services by American to The SABRE Group.
The parties agreed to apply the financial terms of these
agreements as of January 1, 1996, which is reflected in
the reporting segments’ financial highlights noted below.
The following sections provide a discussion of AMR’s
results by reporting segment. The gain on the sale of stock
by a subsidiary of $497 million in 1996 and minority
interest expense of $36 million and $2 million in 1997
and 1996, respectively, have not been allocated to a report-
ing segment. Additional segment information is included
in Note 16 to the consolidated financial statements.
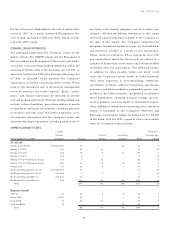
BUSINESS SEGMENT FINANCIAL HIGHLIGHTS
Airline Group
Year Ended December 31,
(dollars in millions) 1997 1996 1995
Revenues
Passenger - American Airlines, Inc. $14,310 $13,645 $ 13,134
Passenger - AMR Eagle 1,017 1,047 976
Cargo 687 682 677
Other 889 837 714
16,903 16,211 15,501
Operating Expenses
Wages, salaries and benefits 5,480 5,191 5,082
Aircraft fuel 1,923 1,936 1,623
Commissions to agents 1,278 1,252 1,293
Depreciation and amortization 1,038 1,018 1,070
Maintenance materials and repairs 861 686 632
Other operating expenses 4,754 4,686 4,704
Restructuring costs - - 533
Total operating expenses 15,334 14,769 14,937
Operating Income 1,569 1,442 564
Other Expense (266) (428) (650)
Earnings (Loss) Before Income
Taxes and Extraordinary Loss $ 1,303 $1,014 $ (86)
Average number of equivalent employees 90,600 88,900 89,400
Operating Statistics
Year Ended December 31,
1997 1996 1995
American Airlines Jet Operations
Revenue passenger miles (millions) 107,026 104,710 102,918
Available seat miles (millions) 153,917 152,886 155,337
Cargo ton miles (millions) 2,032 2,028 2,046
Passenger load factor 69.5% 68.5% 66.3%
Breakeven load factor
excluding special charges 61.0% 60.2% 59.6%
Passenger revenue yield
per passenger mile (cents) 13.37 13.03 12.76
Passenger revenue
per available seat mile (cents) 9.30 8.92 8.46
Cargo revenue yield
per ton mile (cents) 33.78 33.14 32.64
Operating expenses
excluding special charges
per available seat mile (cents) 9.27 8.91 8.57
Operating aircraft at year-end 641 642 635
AMR Eagle
Revenue passenger miles (millions) 2,553 2,590 2,492
Available seat miles (millions) 4,218 4,431 4,488
Passenger load factor 60.5% 58.5% 55.5%
Operating aircraft at year-end 199 205 261