American Express 2003 Annual Report Download - page 100
Download and view the complete annual report
Please find page 100 of the 2003 American Express annual report below. You can navigate through the pages in the report by either clicking on the pages listed below, or by using the keyword search tool below to find specific information within the annual report.-
 1
1 -
2
-
3
-
4
-
5
-
6
-
7
-
8
-
9
-
10
-
11
-
12
-
13
-
14
-
15
-
16
-
17
-
18
-
19
-
20
-
21
-
22
-
23
-
24
-
25
-
26
-
27
-
28
-
29
-
30
-
31
-
32
-
33
-
34
-
35
-
36
-
37
-
38
-
39
-
40
-
41
-
42
-
43
-
44
-
45
-
46
-
47
-
48
-
49
-
50
-
51
-
52
-
53
-
54
-
55
-
56
-
57
-
58
-
59
-
60
-
61
-
62
-
63
-
64
-
65
-
66
-
67
-
68
-
69
-
70
-
71
-
72
-
73
-
74
-
75
-
76
-
77
-
78
-
79
-
80
-
81
-
82
-
83
-
84
-
85
-
86
-
87
-
88
-
89
-
 90
90 -
 91
91 -
 92
92 -
 93
93 -
 94
94 -
 95
95 -
 96
96 -
 97
97 -
 98
98 -
 99
99 -
 100
100 -
 101
101 -
 102
102 -
 103
103 -
 104
104 -
 105
105 -
 106
106 -
 107
107 -
 108
108 -
 109
109 -
 110
110 -
111
-
112
-
113
-
114
-
115
-
116
 |
 |

(Note 14) STOCK PLANS
Under the 1998 Incentive Compensation Plan and previously under the 1989 Long-Term Incentive Plan (the Plans), awards
may be granted to officers, other key employees and other key individuals who perform services for the Company and its par-
ticipating subsidiaries. These awards may be in the form of stock options, stock appreciation rights, restricted stock, perfor-
mance grants and similar awards designed to meet the requirements of non-U.S. jurisdictions. The Company also has options
outstanding pursuant to a Directors’ Stock Option Plan. Under these plans, there were a total of 78 million, 85 million and
48 million common shares available for grant at December 31, 2003, 2002 and 2001, respectively. Each option has an exer-
cise price equal to the market price of the Company’s common stock on the date of grant and with a term of no more than
10 years. Options granted in 2003 generally vest ratably at 25 percent per year beginning with the first anniversary of the
grant date. Options granted prior to 1999 and in 2002 generally vest ratably at 331⁄3percent per year beginning with the first
anniversary of the grant date. Options granted in 1999, 2000 and 2001 generally vest ratably at 331⁄3percent per year begin-
ning with the second anniversary of the grant date. The Company also sponsors the American Express Incentive Savings Plan,
under which purchases of the Company’s common shares are made by or on behalf of participating U.S. employees.
In 1998, the Compensation and Benefits Committee (CBC) adopted a restoration stock option program. In July 2003, the
CBC approved the discontinuance of the restoration feature for new stock options granted on or after January 1, 2004. This
program provides that employees who exercise options that have been outstanding at least five years by surrendering pre-
viously owned shares as payment will automatically receive a new (restoration) stock option with an exercise price equal
to the market price on the date of exercise. The size of the restoration option is equal to the number of shares surrendered
plus any shares surrendered or withheld to satisfy the employees’ income tax requirements. The term of the restoration
option, which is exercisable six months after grant, is equal to the remaining life of the original option.
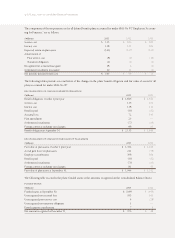
The fair value of each option is estimated on the date of grant using a Black-Scholes option-pricing model with the follow-
ing weighted average assumptions used for grants in 2003, 2002 and 2001:
2003 2002 2001
Dividend yield 1.0% 0.9% 0.8%
Expected volatility 34% 33% 31%
Risk-free interest rate 2.9% 4.3% 4.9%
Expected life of stock option 4.5 years 4.5 years 5.0 years
The dividend yield reflects the assumption that the current dividend payout will continue with no anticipated increases.
The expected life of the options is based on historical data and is not necessarily indicative of exercise patterns that may
occur. The weighted average fair value per option was $10.08, $11.68 and $14.69 for options granted during 2003, 2002 and
2001, respectively.
A summary of the status of the Company’s stock option plans as of December 31 and changes during each of the years then
ended is presented below:
(Shares in thousands) 2003 2002 2001
Weighted Weighted Weighted
Average Average Average
Shares Exercise Price Shares Exercise Price Shares Exercise Price
Outstanding at beginning of year 166,232 $ 37.54 146,069 $ 37.42 114,460 $ 34.23
Granted 12,933 $ 35.01 40,430 $ 36.59 42,883 $ 44.21
Exercised (13,943) $ 29.61 (7,934) $ 24.98 (5,649) $ 20.83
Forfeited/Expired (9,389) $ 40.43 (12,333) $ 40.93 (5,625) $ 40.64
Outstanding at end of year 155,833 $ 37.92 166,232 $ 37.54 146,069 $ 37.42
Options exercisable at end of year 88,263 $ 36.58 61,903 $ 32.86 49,428 $ 29.08
(p.98_axp_ notes to consolidated financial statements)