American Express 2003 Annual Report Download - page 99
Download and view the complete annual report
Please find page 99 of the 2003 American Express annual report below. You can navigate through the pages in the report by either clicking on the pages listed below, or by using the keyword search tool below to find specific information within the annual report.-
 1
1 -
2
-
3
-
4
-
5
-
6
-
7
-
8
-
9
-
10
-
11
-
12
-
13
-
14
-
15
-
16
-
17
-
18
-
19
-
20
-
21
-
22
-
23
-
24
-
25
-
26
-
27
-
28
-
29
-
30
-
31
-
32
-
33
-
34
-
35
-
36
-
37
-
38
-
39
-
40
-
41
-
42
-
43
-
44
-
45
-
46
-
47
-
48
-
49
-
50
-
51
-
52
-
53
-
54
-
55
-
56
-
57
-
58
-
59
-
60
-
61
-
62
-
63
-
64
-
65
-
66
-
67
-
68
-
69
-
70
-
71
-
72
-
73
-
74
-
75
-
76
-
77
-
78
-
79
-
80
-
81
-
82
-
83
-
84
-
85
-
86
-
87
-
88
-
 89
89 -
 90
90 -
 91
91 -
 92
92 -
 93
93 -
 94
94 -
 95
95 -
 96
96 -
 97
97 -
 98
98 -
 99
99 -
 100
100 -
 101
101 -
 102
102 -
 103
103 -
 104
104 -
 105
105 -
 106
106 -
 107
107 -
 108
108 -
 109
109 -
110
-
111
-
112
-
113
-
114
-
115
-
116
 |
 |

For variable rate loans that reprice within a year where there has been no significant change in counterparties’ creditwor-
thiness, fair values are based on carrying values.
The fair values of all other loans (including investment loans), except those with significant credit deterioration, are esti-
mated using discounted cash flow analysis, based on current interest rates for loans with similar terms to borrowers of sim-
ilar credit quality. For loans with significant credit deterioration, fair values are based on estimates of future cash flows
discounted at rates commensurate with the risk inherent in the revised cash flow projections, or for collateral dependent
loans on collateral values.
Financial Liabilities
Liabilities for which carrying values approximate fair values include customers’ deposits, Travelers Cheques outstanding,
accounts payable, short-term debt, certain other liabilities and derivative financial instruments.
Fair values of fixed annuities in deferral status are estimated as the accumulated value less applicable surrender charges and
loans. For annuities in payout status, fair value is estimated using discounted cash flows, based on current interest rates.
The fair value of these reserves excludes life insurance related elements of $1.4 billion in both 2003 and 2002.
For variable rate investment certificates that reprice within a year, fair values approximate carrying values. For other invest-
ment certificates, fair value is estimated using discounted cash flows based on current interest rates. The valuations are
reduced by the amount of applicable surrender charges and related loans.
For variable rate long-term debt that reprices within a year, fair values approximate carrying values. For other long-term
debt, fair value is estimated using either quoted market prices or discounted cash flows based on the Company’s current
borrowing rates for similar types of borrowing.
Fair values of separate account liabilities, after excluding life insurance-related elements of $3.5 billion and $2.6 billion in
2003 and 2002, respectively, are estimated as the accumulated value less applicable surrender charges.
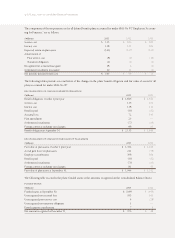
(Note 13) SIGNIFICANT CREDIT CONCENTRATIONS
A credit concentration may exist if customers are involved in similar industries. The Company’s customers operate in diverse
economic sectors. Therefore, management does not expect any material adverse consequences to the Company’s financial
position to result from credit concentrations. Certain distinctions between categories require management judgment. The
following table represents the Company’s maximum credit exposure by industry at December 31, 2003 and 2002:
December 31, (Dollars in millions) 2003 2002
Financial institutions(a) $20,711 $16,635
Individuals, including credit and charge cards(b) 216,369 181,534
U.S. Government and agencies(c) 23,988 29,604
All other 28,759 25,733
Total $289,827 $253,506
Composition:
On-balance sheet 46% 49%
Off-balance sheet 54 51
Total 100% 100%
(a) Financial institutions primarily include banks, broker-dealers, insurance companies and savings and loan associations.
(b) Charge card products have no preset spending limit; therefore, the quantified credit amount includes only cardmember receivables recorded on the Consolidated Balance Sheets.
(c) U.S. Government and agencies represent the U.S. Government and its agencies, states and municipalities, and quasi-government agencies.
The Company also uses master netting agreements which allow the Company to settle multiple contracts with a single coun-
terparty in one net receipt or payment in the event of counterparty default.
(p.97_axp_ notes to consolidated financial statements)