American Express 2003 Annual Report Download - page 98
Download and view the complete annual report
Please find page 98 of the 2003 American Express annual report below. You can navigate through the pages in the report by either clicking on the pages listed below, or by using the keyword search tool below to find specific information within the annual report.-
 1
1 -
2
-
3
-
4
-
5
-
6
-
7
-
8
-
9
-
10
-
11
-
12
-
13
-
14
-
15
-
16
-
17
-
18
-
19
-
20
-
21
-
22
-
23
-
24
-
25
-
26
-
27
-
28
-
29
-
30
-
31
-
32
-
33
-
34
-
35
-
36
-
37
-
38
-
39
-
40
-
41
-
42
-
43
-
44
-
45
-
46
-
47
-
48
-
49
-
50
-
51
-
52
-
53
-
54
-
55
-
56
-
57
-
58
-
59
-
60
-
61
-
62
-
63
-
64
-
65
-
66
-
67
-
68
-
69
-
70
-
71
-
72
-
73
-
74
-
75
-
76
-
77
-
78
-
79
-
80
-
81
-
82
-
83
-
84
-
85
-
86
-
87
-
 88
88 -
 89
89 -
 90
90 -
 91
91 -
 92
92 -
 93
93 -
 94
94 -
 95
95 -
 96
96 -
 97
97 -
 98
98 -
 99
99 -
 100
100 -
 101
101 -
 102
102 -
 103
103 -
 104
104 -
 105
105 -
 106
106 -
 107
107 -
 108
108 -
109
-
110
-
111
-
112
-
113
-
114
-
115
-
116
 |
 |

The Company leases certain office facilities and operating equipment under noncancelable and cancelable agreements. Total
rental expense amounted to $420 million, $461 million and $491 million in 2003, 2002 and 2001, respectively. At Decem-
ber 31, 2003, the minimum aggregate rental commitment under all noncancelable operating leases (net of subleases) was
(millions): 2004, $273; 2005, $238; 2006, $208; 2007, $181; 2008, $147; and thereafter, $1,440.
(Note 11) CONTINGENCIES
The Company and its subsidiaries are involved in a number of legal and arbitration proceedings, including class actions,
concerning matters arising in connection with the conduct of their respective business activities. The Company believes it
has meritorious defenses to each of these actions and intends to defend them vigorously. The Company believes it is not a
party to, nor are any of its properties the subject of, any pending legal or arbitration proceedings which would have a mate-
rial adverse effect on the Company’s consolidated financial condition, results of operations or liquidity. However, it is pos-
sible that the outcome of any such proceedings could have a material impact on results of operations in any particular
reporting period as the proceedings are resolved.
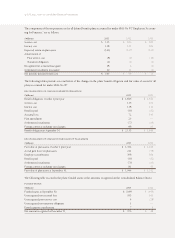
(Note 12) FAIR VALUES OF FINANCIAL INSTRUMENTS
The following table discloses fair value information for financial instruments. Certain items, such as life insurance obliga-
tions, employee benefit obligations, investments accounted for under the equity method and deferred acquisition costs are
excluded. The fair values of financial instruments are estimates based upon market conditions and perceived risks at Decem-
ber 31, 2003 and 2002 and require management judgment. These figures may not be indicative of their future fair values.
Additionally, management believes the value of excluded assets and liabilities is significant. The fair value of the Company,
therefore, cannot be estimated by aggregating the amounts presented.
December 31, (Millions) 2003 2002
Carrying Value Fair Value Carrying Value Fair Value
Financial Assets
Assets for which carrying values
approximate fair values $72,953 $ 72,953 $64,855 $ 64,855
Investments $57,067 $ 57,389 $53,638 $ 54,062
Loans $32,720 $ 32,690 $28,398 $ 28,478
Financial Liabilities
Liabilities for which carrying values
approximate fair values $57,995 $ 57,995 $59,600 $ 59,600
Fixed annuity reserves $24,873 $ 24,113 $21,911 $ 21,283
Investment certificate reserves $9,191 $ 9,235 $8,647 $ 8,673
Long-term debt $20,654 $ 20,918 $16,308 $ 16,571
Separate account liabilities $27,316 $ 26,354 $19,392 $ 18,539
The carrying and fair values of off-balance sheet financial instruments discussed in Note 10 are not material as of Decem-
ber 31, 2003 and 2002. See Note 2 for carrying and fair value information regarding investments. The following methods
were used to estimate the fair values of financial assets and financial liabilities.
Financial Assets
Assets for which carrying values approximate fair values include cash and cash equivalents, accounts receivable and accrued
interest, separate account assets, certain other assets and derivative financial instruments.
Generally, investments are carried at fair value on the Consolidated Balance Sheets. Gains and losses are recognized in the
results of operations upon disposition of the securities. In addition, losses are recognized when management determines
that a decline in value is other-than-temporary.
(p.96_axp_ notes to consolidated financial statements)