American Express 2003 Annual Report Download - page 62
Download and view the complete annual report
Please find page 62 of the 2003 American Express annual report below. You can navigate through the pages in the report by either clicking on the pages listed below, or by using the keyword search tool below to find specific information within the annual report.-
 1
1 -
2
-
3
-
4
-
5
-
6
-
7
-
8
-
9
-
10
-
11
-
12
-
13
-
14
-
15
-
16
-
17
-
18
-
19
-
20
-
21
-
22
-
23
-
24
-
25
-
26
-
27
-
28
-
29
-
30
-
31
-
32
-
33
-
34
-
35
-
36
-
37
-
38
-
39
-
40
-
41
-
42
-
43
-
44
-
45
-
46
-
47
-
48
-
49
-
50
-
51
-
 52
52 -
 53
53 -
 54
54 -
 55
55 -
 56
56 -
 57
57 -
 58
58 -
 59
59 -
 60
60 -
 61
61 -
 62
62 -
 63
63 -
 64
64 -
 65
65 -
 66
66 -
 67
67 -
 68
68 -
 69
69 -
 70
70 -
 71
71 -
 72
72 -
73
-
74
-
75
-
76
-
77
-
78
-
79
-
80
-
81
-
82
-
83
-
84
-
85
-
86
-
87
-
88
-
89
-
90
-
91
-
92
-
93
-
94
-
95
-
96
-
97
-
98
-
99
-
100
-
101
-
102
-
103
-
104
-
105
-
106
-
107
-
108
-
109
-
110
-
111
-
112
-
113
-
114
-
115
-
116
 |
 |

(p.60_axp_ financial review)
AMERICAN EXPRESS FINANCIAL ADVISORS
Results of Operations
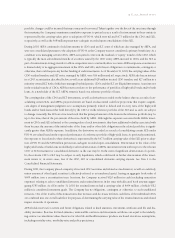
STATEMENTS OF INCOME
Years Ended December 31, (Millions) 2003 2002 2001
Revenues:
Investment income $2,279 $2,058 $ 1,162
Management and distribution fees 2,458 2,292 2,458
Other revenues 1,435 1,267 1,171
Total revenues 6,172 5,617 4,791
Expenses:
Provision for losses and benefits:
Annuities 1,104 1,034 989
Insurance 817 737 648
Investment certificates 201 183 329
Total 2,122 1,954 1,966
Human resources 2,090 1,898 1,969
Other operating expenses 1,101 907 762
Restructuring charges ——107
Disaster recovery charge —(7) 11
Total expenses 5,313 4,752 4,815
Pretax income (loss) before accounting change 859 865 (24)
Income tax provision (benefit) 177 233 (76)
Income before accounting change 682 632 52
Cumulative effect of accounting change, net of tax (13) ——
Net income $669 $632 $ 52
In 2003, American Express Financial Advisors generated improved revenues on increased investment income and manage-
ment and distribution fees primarily due to strengthening markets, higher asset levels and the acquisition of Threadneedle.
AEFA’s 2003 income before accounting change rose 8 percent to $682 million. AEFA’s net income increased 6 percent to
$669 million in 2003, up from $632 million in 2002 and $52 million in 2001. AEFA’s 2003 results reflect a $41 million
reduction in tax expense due to adjustments related to the finalization of the 2002 tax return filed during the third quarter
and the publication of favorable technical guidance related to the taxation of dividend income. Results for 2003 also reflect
the impact of the December 31, 2003 adoption of FIN 46, as revised, which addresses consolidation by business enterprises
of VIEs and is discussed in more detail below. Results for 2002 included a benefit of $7 million ($4 million after-tax) to
reverse a portion of the 2001 September 11th related reserves as a result of lower than anticipated insured loss claims.
Included in 2001 results are restructuring charges of $107 million ($70 million after-tax) and one-time costs of $11 million
($8 million after-tax) directly related to the September 11th terrorist attacks. In addition, investment income and results for
2001 included $1.01 billion in charges ($669 million after-tax) from the write down and sale of high-yield securities and
from reducing risk within its investment portfolio.
Total revenues increased 10 percent in 2003 primarily due to higher investment income, increased management fees from
higher average assets under management primarily reflecting the Threadneedle acquisition, increased distribution fees and
greater insurance premiums. Total revenues rose 17 percent in 2002 due to higher investment income, reflecting the impact
of the high-yield losses noted previously and higher levels of invested assets, higher insurance premiums and advice ser-
vices fees, and higher distribution fees, partially offset by reduced management fees.