American Express 2003 Annual Report Download - page 41
Download and view the complete annual report
Please find page 41 of the 2003 American Express annual report below. You can navigate through the pages in the report by either clicking on the pages listed below, or by using the keyword search tool below to find specific information within the annual report.-
 1
1 -
2
-
3
-
4
-
5
-
6
-
7
-
8
-
9
-
10
-
11
-
12
-
13
-
14
-
15
-
16
-
17
-
18
-
19
-
20
-
21
-
22
-
23
-
24
-
25
-
26
-
27
-
28
-
29
-
30
-
 31
31 -
 32
32 -
 33
33 -
 34
34 -
 35
35 -
 36
36 -
 37
37 -
 38
38 -
 39
39 -
 40
40 -
 41
41 -
 42
42 -
 43
43 -
 44
44 -
 45
45 -
 46
46 -
 47
47 -
 48
48 -
 49
49 -
 50
50 -
 51
51 -
52
-
53
-
54
-
55
-
56
-
57
-
58
-
59
-
60
-
61
-
62
-
63
-
64
-
65
-
66
-
67
-
68
-
69
-
70
-
71
-
72
-
73
-
74
-
75
-
76
-
77
-
78
-
79
-
80
-
81
-
82
-
83
-
84
-
85
-
86
-
87
-
88
-
89
-
90
-
91
-
92
-
93
-
94
-
95
-
96
-
97
-
98
-
99
-
100
-
101
-
102
-
103
-
104
-
105
-
106
-
107
-
108
-
109
-
110
-
111
-
112
-
113
-
114
-
115
-
116
 |
 |

The Company’s funding strategy is designed to maintain high and stable debt ratings from the major credit rating agencies,
Moody’s, Standard & Poor’s, and FitchRatings. Maintenance of high and stable debt ratings is critical to ensuring the Com-
pany has continuous access to the capital and credit markets. It also enables the Company to reduce its overall borrowing
costs. At December 31, 2003, its debt ratings were as follows:
Standard
Moody’s & Poor’s FitchRatings
Short-term P-1 A-1 F-1
Senior unsecured A1 A+ A+
The Company has strengthened its liquidity position over the last few years through reductions in the amount of short-term
debt outstanding, by extending and spreading out the maturities of long-term debt and through the establishment of an
investment pool of high quality, liquid assets.
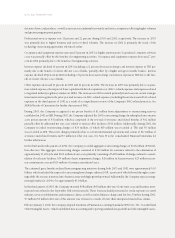
In 2003, the Company continued to reduce its reliance on short-term debt. At December 31, 2003, on a GAAP basis short-
term debt was 48.0% of total debt versus 56.4% a year ago. On a managed basis, short-term debt at December 31, 2003 was
32.2% of total debt versus 38.6% a year ago. Term debt offerings of $12.5 billion in 2003 were issued to refinance matur-
ing long-term obligations, fund business growth and decrease short-term debt obligations.
December 31, ($ in billions) 2003 2002 2001
Short-term debt $19.0 $21.1 $ 31.6
Short-term debt percentage of total debt (GAAP basis) 48.0% 56.4% 80.2%
Short-term debt percentage of total debt (managed basis) 32.2% 38.6% 58.0%
% of Total Term Debt Issued
Maturity (Years)
50%
40%
30%
20%
10%
0%
DEBT ISSUANCE GREATER THAN ONE YEAR: MATURITY DISTRIBUTION FOR 2003 AND 2002
2003 2002
11.5 2 3 4 5 7 10
(p.39_axp_ financial review)