American Express 2003 Annual Report Download - page 4
Download and view the complete annual report
Please find page 4 of the 2003 American Express annual report below. You can navigate through the pages in the report by either clicking on the pages listed below, or by using the keyword search tool below to find specific information within the annual report.-
 1
1 -
 2
2 -
 3
3 -
 4
4 -
 5
5 -
 6
6 -
 7
7 -
 8
8 -
 9
9 -
 10
10 -
 11
11 -
 12
12 -
 13
13 -
 14
14 -
 15
15 -
16
-
17
-
18
-
19
-
20
-
21
-
22
-
23
-
24
-
25
-
26
-
27
-
28
-
29
-
30
-
31
-
32
-
33
-
34
-
35
-
36
-
37
-
38
-
39
-
40
-
41
-
42
-
43
-
44
-
45
-
46
-
47
-
48
-
49
-
50
-
51
-
52
-
53
-
54
-
55
-
56
-
57
-
58
-
59
-
60
-
61
-
62
-
63
-
64
-
65
-
66
-
67
-
68
-
69
-
70
-
71
-
72
-
73
-
74
-
75
-
76
-
77
-
78
-
79
-
80
-
81
-
82
-
83
-
84
-
85
-
86
-
87
-
88
-
89
-
90
-
91
-
92
-
93
-
94
-
95
-
96
-
97
-
98
-
99
-
100
-
101
-
102
-
103
-
104
-
105
-
106
-
107
-
108
-
109
-
110
-
111
-
112
-
113
-
114
-
115
-
116
 |
 |

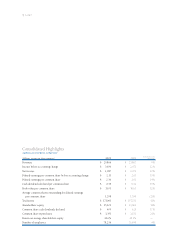
Consolidated Highlights
AMERICAN EXPRESS COMPANY
Percent Increase
(Millions, except per share amounts) 2003 2002 (Decrease)
Revenues $ 25,866 $23,807 9%
Income before accounting change $ 3,000 $2,671 12%
Net income $ 2,987 $2,671 12%
Diluted earnings per common share before accounting change $ 2.31 $2.01 15%
Diluted earnings per common share $ 2.30 $2.01 14%
Cash dividends declared per common share $ 0.38 $0.32 19%
Book value per common share $ 11.93 $10.63 12%
Average common shares outstanding for diluted earnings
per common share 1,298 1,330 (2)%
Total assets $ 175,001 $157,253 11%
Shareholders’ equity $ 15,323 $13,861 11%
Common share cash dividends declared $ 495 $425 17%
Common share repurchases $ 1,391 $1,153 21%
Return on average shareholders’ equity 20.6% 20.2% —
Number of employees 78,236 75,459 4%
(p.2_axp)