American Express 2003 Annual Report Download - page 11
Download and view the complete annual report
Please find page 11 of the 2003 American Express annual report below. You can navigate through the pages in the report by either clicking on the pages listed below, or by using the keyword search tool below to find specific information within the annual report.-
 1
1 -
 2
2 -
 3
3 -
 4
4 -
 5
5 -
 6
6 -
 7
7 -
 8
8 -
 9
9 -
 10
10 -
 11
11 -
 12
12 -
 13
13 -
 14
14 -
 15
15 -
 16
16 -
 17
17 -
 18
18 -
 19
19 -
 20
20 -
 21
21 -
 22
22 -
23
-
24
-
25
-
26
-
27
-
28
-
29
-
30
-
31
-
32
-
33
-
34
-
35
-
36
-
37
-
38
-
39
-
40
-
41
-
42
-
43
-
44
-
45
-
46
-
47
-
48
-
49
-
50
-
51
-
52
-
53
-
54
-
55
-
56
-
57
-
58
-
59
-
60
-
61
-
62
-
63
-
64
-
65
-
66
-
67
-
68
-
69
-
70
-
71
-
72
-
73
-
74
-
75
-
76
-
77
-
78
-
79
-
80
-
81
-
82
-
83
-
84
-
85
-
86
-
87
-
88
-
89
-
90
-
91
-
92
-
93
-
94
-
95
-
96
-
97
-
98
-
99
-
100
-
101
-
102
-
103
-
104
-
105
-
106
-
107
-
108
-
109
-
110
-
111
-
112
-
113
-
114
-
115
-
116
 |
 |
(p.9_axp)
card transactions (known as the “discount rate”). Because of American Express cardmembers’ spending pat-
terns, we are able to deliver more high-spending customers to merchants and therefore earn a premium dis-
count rate. As a result, we are able to generate higher revenues from spending than our competitors, who tend
to rely more heavily on interest income from extending credit to their customers. This higher revenue stream
gives American Express greater flexibility to offer more attractive rewards and other incentives to keep cus-
tomers spending more on their cards, thus driving more business to merchants who accept the Card.
In contrast, nearly all of American Express’ competitors have business models that are focused on lending,
which creates the need for a steady stream of new customers and balance transfers to produce growth. To keep
this stream flowing, many lending-model companies compete by lowering interest rates to attract customers
(which also reduces profit margins) and by aggressively pursuing opportunities to buy card portfolios from
other companies. Although our lending portfolio is a strong and growing portion of our business, we view lend-
ing revenue as a natural extension and complement to our key focus — spending.
The benefits we derive from our focus on the spending model give us a unique competitive advantage that we
are leveraging to provide more value to our customers, our merchants and our card-issuing partners.
NEW PRODUCTS, SERVICES AND RELATIONSHIPS
To expand upon these advantages, we significantly increased our investment spending at TRS during 2003.
Total spending on marketing, promotion, rewards and cardmember services at TRS was up 26 percent for the
full year. This was on top of our already increased level of spending in 2002.
We launched innovative card products around the world, enriched our rewards programs, expanded our mer-
chant network and formed partnerships that enhanced the value we provide to our customers.
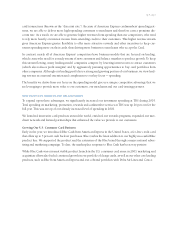
Growing Our U.S. Consumer Card Business
Early in the year, we introduced Blue Cash from American Express in the United States, a fee-free credit card
that offers up to 5 percent cash back on purchases. Blue Cash is the latest addition to our highly successful Blue
product line. We supported the product and the extension of the Blue brand through a major national adver-
tising and marketing campaign. To date, the marketplace response to Blue Cash has been very positive.
While Blue Cash was our most visible product launch in the U.S. consumer card arena in 2003, marketing and
acquisition efforts also fueled continued growth in our portfolio of charge cards, as well as our other core lending
products, such as Blue from American Express and our cobrand portfolios with Delta Air Lines and Costco.