American Express 2003 Annual Report Download - page 108
Download and view the complete annual report
Please find page 108 of the 2003 American Express annual report below. You can navigate through the pages in the report by either clicking on the pages listed below, or by using the keyword search tool below to find specific information within the annual report.-
 1
1 -
2
-
3
-
4
-
5
-
6
-
7
-
8
-
9
-
10
-
11
-
12
-
13
-
14
-
15
-
16
-
17
-
18
-
19
-
20
-
21
-
22
-
23
-
24
-
25
-
26
-
27
-
28
-
29
-
30
-
31
-
32
-
33
-
34
-
35
-
36
-
37
-
38
-
39
-
40
-
41
-
42
-
43
-
44
-
45
-
46
-
47
-
48
-
49
-
50
-
51
-
52
-
53
-
54
-
55
-
56
-
57
-
58
-
59
-
60
-
61
-
62
-
63
-
64
-
65
-
66
-
67
-
68
-
69
-
70
-
71
-
72
-
73
-
74
-
75
-
76
-
77
-
78
-
79
-
80
-
81
-
82
-
83
-
84
-
85
-
86
-
87
-
88
-
89
-
90
-
91
-
92
-
93
-
94
-
95
-
96
-
97
-
 98
98 -
 99
99 -
 100
100 -
 101
101 -
 102
102 -
 103
103 -
 104
104 -
 105
105 -
 106
106 -
 107
107 -
 108
108 -
 109
109 -
 110
110 -
 111
111 -
 112
112 -
 113
113 -
 114
114 -
 115
115 -
 116
116
 |
 |

Income tax provision (benefit) is calculated on a separate return basis; however, benefits from operating losses, loss car-
rybacks and tax credits (principally foreign tax credits) recognizable for the Company’s consolidated reporting purpos-
es are allocated based upon the tax sharing agreement among members of the American Express Company consolidated
U.S. tax group.
Assets are those that are used or generated exclusively by each industry segment. The adjustments and eliminations required
to determine the consolidated amounts shown above consist principally of the elimination of inter-segment amounts.
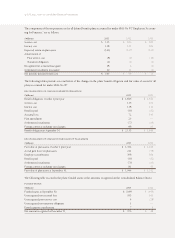
Geographic Operations
The following table presents the Company’s revenues and pretax income in different geographic regions:
Adjustments
United and
(Millions) States Europe Asia/Pacific All Other Eliminations Consolidated
2003
Revenues $20,859 $ 2,303 $ 1,992 $ 1,852 $ (1,140) $ 25,866
Pretax income before
accounting change(a) $3,385 $ 396 $ 216 $ 250 — $ 4,247
2002
Revenues $19,286 $ 1,943 $ 1,685 $ 1,586 $ (693) $ 23,807
Pretax income $2,983 $ 310 $ 181 $ 253 — $ 3,727
2001
Revenues $17,522 $ 2,556 $ 1,523 $ 1,667 $ (686) $ 22,582
Pretax income $1,177 $ 101 $ 159 $ 159 — $ 1,596
(a) 2003 results reflect a $20 million non-cash pretax charge ($13 million after-tax) related to the December 31, 2003 adoption of FIN 46, as revised.
Net foreign currency transaction (losses) gains amounted to ($183 million), ($77 million) and $16 million in 2003, 2002
and 2001, respectively.
Most services of the Company are provided on an integrated worldwide basis. Therefore, it is not practicable to separate
precisely the U.S. and international services. Accordingly, the data in the above table are, in part, based upon internal
allocations, which necessarily involve management’s judgment.
(Note 19) RESTRUCTURING CHARGES
In the third and fourth quarters of 2001, the Company recorded aggregate restructuring charges of $631 million
($411 million after-tax). The aggregate restructuring charges consisted of $369 million for severance related to the origi-
nal plans to eliminate approximately 12,900 jobs and $262 million of exit costs primarily consisting of $138 million of
charges related to the consolidation of real estate facilities, $35 million of asset impairment charges, $26 million record-
ed in loss provisions, $25 million in contract termination costs and $24 million of currency translation losses.
During the year ended December 31, 2002, the Company adjusted the prior year’s aggregate restructuring charge liabil-
ity by taking back into income a net pretax amount of $31 million ($20 million after-tax). This was comprised of the
reversal of severance and related benefits of $62 million, primarily caused by voluntary attrition or redeployment into
open jobs of approximately 4,100 employees whose jobs were eliminated, partially offset by additional net exit costs of
$31 million. These net exit costs included $46 million of additional costs relating to certain domestic and international
office facilities, a $20 million reduction primarily due to revisions to plans relating to certain travel office locations and
a $5 million additional charge for write-offs of building and related costs in facilities affected by the restructuring plan.
During the second half of 2002, the Company recorded new restructuring charges of $19 million ($12 million after-tax)
at TRS and, due to additional reviews of operations, $5 million ($3 million after-tax) at AEB. The TRS charge consists of
$14 million of severance, relating to the elimination of approximately 500 jobs, and $5 million of other costs primarily
(p.106_axp_ notes to consolidated financial statements)