American Express 2003 Annual Report Download - page 106
Download and view the complete annual report
Please find page 106 of the 2003 American Express annual report below. You can navigate through the pages in the report by either clicking on the pages listed below, or by using the keyword search tool below to find specific information within the annual report.-
 1
1 -
2
-
3
-
4
-
5
-
6
-
7
-
8
-
9
-
10
-
11
-
12
-
13
-
14
-
15
-
16
-
17
-
18
-
19
-
20
-
21
-
22
-
23
-
24
-
25
-
26
-
27
-
28
-
29
-
30
-
31
-
32
-
33
-
34
-
35
-
36
-
37
-
38
-
39
-
40
-
41
-
42
-
43
-
44
-
45
-
46
-
47
-
48
-
49
-
50
-
51
-
52
-
53
-
54
-
55
-
56
-
57
-
58
-
59
-
60
-
61
-
62
-
63
-
64
-
65
-
66
-
67
-
68
-
69
-
70
-
71
-
72
-
73
-
74
-
75
-
76
-
77
-
78
-
79
-
80
-
81
-
82
-
83
-
84
-
85
-
86
-
87
-
88
-
89
-
90
-
91
-
92
-
93
-
94
-
95
-
 96
96 -
 97
97 -
 98
98 -
 99
99 -
 100
100 -
 101
101 -
 102
102 -
 103
103 -
 104
104 -
 105
105 -
 106
106 -
 107
107 -
 108
108 -
 109
109 -
 110
110 -
 111
111 -
 112
112 -
 113
113 -
 114
114 -
 115
115 -
 116
116
 |
 |

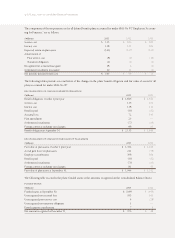
(Note 17) EARNINGS PER COMMON SHARE
Basic EPS is computed using the average actual shares outstanding during the period. Diluted EPS is basic EPS adjusted for
the dilutive effect of stock options, RSAs and other financial instruments that may be converted into common shares. The
basic and diluted EPS computations are as follows:
(Millions, except per share amounts) 2003 2002 2001
Numerator:
Income before accounting change $3,000 $2,671 $ 1,311
Cumulative effect of accounting change, net of tax (13) — —
Net income $2,987 $2,671 $ 1,311
Denominator:
Basic: Weighted-average shares outstanding during the period 1,284 1,320 1,324
Add: Dilutive effect of stock options, restricted stock awards
and other dilutive securities 14 10 12
Diluted 1,298 1,330 1,336
Basic EPS:
Income before accounting change $2.34 $2.02 $ 0.99
Cumulative effect of accounting change, net of tax (0.01) — —
Net income $2.33 $2.02 $ 0.99
Diluted EPS:
Income before accounting change $2.31 $2.01 $ 0.98
Cumulative effect of accounting change, net of tax (0.01) — —
Net income $2.30 $2.01 $ 0.98
Stock options having an exercise price greater than the average market price of the Company’s common shares for each
period presented are excluded from the computation of EPS because the effect would be antidilutive. The number of these
excluded stock options for the years ended December 31, 2003, 2002 and 2001 was 65 million, 101 million and 72 million,
respectively. The convertible debentures issued in November 2003 have been excluded from the computation of EPS
because none of the criteria by which this instrument becomes convertible has been attained.
(Note 18) OPERATING SEGMENTS AND GEOGRAPHIC OPERATIONS
Operating Segments
The Company is principally engaged in providing travel-related, financial advisory and international banking services
throughout the world. TRS’ products and services include, among others, charge cards, cardmember lending products, Trav-
elers Cheques, and corporate and consumer travel services. AEFA’s services and products include financial planning and
advice, investment advisory services and a variety of products, including insurance and annuities, investment certificates
and mutual funds. AEB’s products and services include providing private, financial institution and corporate banking; per-
sonal financial services and global trading. The Company operates on a global basis, although the principal market for finan-
cial advisory services is the United States.
The following table presents certain information regarding these operating segments, based on management’s evaluation
and internal reporting structure, at December 31, 2003, 2002 and 2001 and for each of the years then ended. The segment
results have been affected by charges discussed in Notes 19 and 20. For certain income statement items that are affected by
asset securitizations at TRS, data are provided on both a managed basis, which excludes the effect of securitizations, as well
as on a GAAP basis. Pretax income and net income are the same under both a GAAP and managed basis. See Note 4 for fur-
ther information regarding the effect of securitizations on the financial statements. In addition, net revenues (managed basis)
are presented net of provisions for losses and benefits for annuities, insurance and investment certificate products of AEFA
which are essentially spread businesses.
(p.104_axp_ notes to consolidated financial statements)