Electronic Arts 2001 Annual Report Download - page 19
Download and view the complete annual report
Please find page 19 of the 2001 Electronic Arts annual report below. You can navigate through the pages in the report by either clicking on the pages listed below, or by using the keyword search tool below to find specific information within the annual report.-
 1
1 -
2
-
3
-
4
-
5
-
6
-
7
-
8
-
 9
9 -
 10
10 -
 11
11 -
 12
12 -
 13
13 -
 14
14 -
 15
15 -
 16
16 -
 17
17 -
 18
18 -
 19
19 -
 20
20 -
 21
21 -
 22
22 -
 23
23 -
 24
24 -
 25
25 -
 26
26 -
 27
27 -
 28
28 -
 29
29 -
30
-
31
-
32
-
33
-
34
-
35
-
36
-
37
-
38
-
39
-
40
-
41
-
42
-
43
-
44
-
45
-
46
-
47
-
48
-
49
-
50
-
51
-
52
-
53
-
54
-
55
-
56
-
57
-
58
-
59
-
60
-
61
-
62
-
63
-
64
-
65
-
66
-
67
-
68
-
69
-
70
-
71
-
72
 |
 |

ELECTRONIC ARTS
17
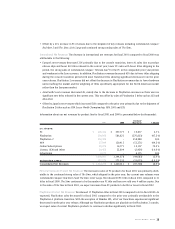
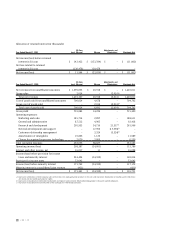
Operations by Segment
The series of common stock designated as Class B (see Note 2) was approved to reflect the
performance of EA.com. Accordingly, management considers EA.com to be a separate reportable segment. Prior
period information has been restated to disclose this separate segment. We operate in two principal business seg-
ments globally:
• Electronic Arts Core (“EA Core”) business segment: creation, marketing and distribution of entertainment software.
• EA.com business segment: creation, marketing and distribution of entertainment software which can be played
or sold online, ongoing management of subscriptions of online games and website advertising.
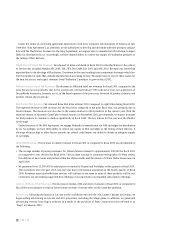
EA.com, a division of Electronic Arts Inc., represents Electronic Arts’ online and e-Commerce businesses.
EA.com’s business includes subscription revenues collected for Internet gameplay on our websites, website adver-
tising, sales of packaged goods for Internet-only based games and sales of Electronic Arts games sold through the
EA.com web store. The Consolidated Statement of Operations includes all revenues and costs directly attributable
to EA.com, including charges for shared facilities, functions and services used by EA.com and provided by
Electronic Arts. Certain costs and expenses have been allocated based on management’s estimates of the cost of
services provided to EA.com by Electronic Arts.
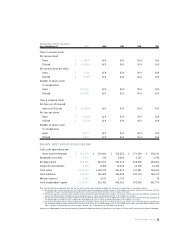
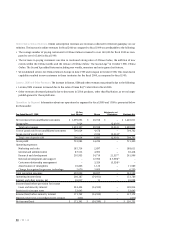
Information about our operations by segment for fiscal 2001 and 2000 is presented below (in thousands):
EA Core Adjustments and
Year Ended March 31, 2001 (excl. EA.com) EA.com Eliminations Electronic Arts
Net revenues from unaffiliated customers $ 1,280,172 $ 42,101 $ – $ 1,322,273
Group sales 2,658 – (2,658)(a) –
Total net revenues 1,282,830 42,101 (2,658) 1,322,273
Cost of goods sold from unaffiliated customers 640,239 12,003 – 652,242
Group cost of goods sold – 2,658 (2,658)(a) –
Total cost of goods sold 640,239 14,661 (2,658) 652,242
Gross profit 642,591 27,440 – 670,031
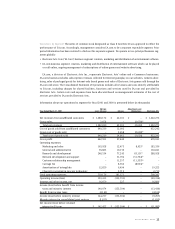
Operating expenses:
Marketing and sales 163,928 12,475 8,933(c) 185,336
General and administrative 93,885 10,156 – 104,041
Research and development 248,534 77,243 63,151(b) 388,928
Network development and support – 51,794 (51,794)(b) –
Customer relationship management – 11,357 (11,357)(b) –
Carriage fee – 8,933 (8,933)(c) –
Amortization of intangibles 12,829 6,494 – 19,323
Charge for acquired in-process technology – 2,719 – 2,719
Total operating expenses 519,176 181,171 – 700,347
Operating income (loss) 123,415 (153,731) – (30,316)
Interest and other income, net 16,659 227 – 16,886
Income (loss) before benefit from income
taxes and minority interest 140,074 (153,504) – (13,430)
Benefit from income taxes (4,163) – – (4,163)
Income (loss) before minority interest 144,237 (153,504) – (9,267)
Minority interest in consolidated joint venture (1,815) – – (1,815)
Net income (loss) before retained
interest in EA.com $ 142,422 $ (153,504) $ – $ (11,082)