Electronic Arts 2001 Annual Report Download - page 53
Download and view the complete annual report
Please find page 53 of the 2001 Electronic Arts annual report below. You can navigate through the pages in the report by either clicking on the pages listed below, or by using the keyword search tool below to find specific information within the annual report.-
 1
1 -
2
-
3
-
4
-
5
-
6
-
7
-
8
-
9
-
10
-
11
-
12
-
13
-
14
-
15
-
16
-
17
-
18
-
19
-
20
-
21
-
22
-
23
-
24
-
25
-
26
-
27
-
28
-
29
-
30
-
31
-
32
-
33
-
34
-
35
-
36
-
37
-
38
-
39
-
40
-
41
-
42
-
 43
43 -
 44
44 -
 45
45 -
 46
46 -
 47
47 -
 48
48 -
 49
49 -
 50
50 -
 51
51 -
 52
52 -
 53
53 -
 54
54 -
 55
55 -
 56
56 -
 57
57 -
 58
58 -
 59
59 -
 60
60 -
 61
61 -
 62
62 -
 63
63 -
64
-
65
-
66
-
67
-
68
-
69
-
70
-
71
-
72
 |
 |

ELECTRONIC ARTS
51
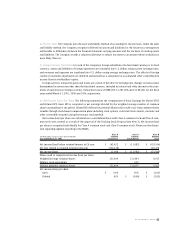
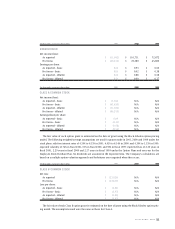
(In thousands, except per share data)
2001 2000 1999
CONSOLIDATED
Net income (loss):
As reported $ (11,082) $ 116,751 $ 72,872
Pro forma $ (69,350) $ 78,380 $ 45,886
Earnings per share:
As reported – basic N/A $ 0.93 $ 0.60
Pro forma – basic N/A $ 0.62 $ 0.38
As reported – diluted N/A $ 0.88 $ 0.58
Pro forma – diluted N/A $ 0.60 $ 0.37
(In thousands, except per share data)
2001 2000 1999
CLASS A COMMON STOCK
Net income (loss):
As reported – basic $ 11,944 N/A N/A
Pro forma – basic $ (45,493) N/A N/A
As reported – diluted $ (11,082) N/A N/A
Pro forma – diluted $ (69,350) N/A N/A
Earnings (loss) per share:
As reported – basic $ 0.09 N/A N/A
Pro forma – basic $ (0.35) N/A N/A
As reported – diluted $ (0.08) N/A N/A
Pro forma – diluted $ (0.53) N/A N/A
The fair value of each option grant is estimated on the date of grant using the Black-Scholes option-pricing
model. The following weighted-average assumptions are used for grants made in 2001, 2000 and 1999 under the
stock plans: risk-free interest rates of 4.59% to 6.55% in 2001; 4.93% to 6.54% in 2000; and 4.39% to 5.55% in 1999;
expected volatility of 74% in fiscal 2001, 65% in fiscal 2000, and 59% in fiscal 1999; expected lives of 2.32 years in
fiscal 2001, 2.29 years in fiscal 2000 and 2.27 years in fiscal 1999 under the Option Plans and one year for the
Employee Stock Purchase Plan. No dividends are assumed in the expected term. The Company’s calculations are
based on a multiple option valuation approach and forfeitures are recognized when they occur.
(In thousands, except per share data)
2001 2000 1999
CLASS B COMMON STOCK
Net loss:
As reported $ (23,026) N/A N/A
Pro forma $ (23,857) N/A N/A
Loss per share:
As reported – basic $ (3.83) N/A N/A
Pro forma – basic $ (3.97) N/A N/A
As reported – diluted $ (3.83) N/A N/A
Pro forma – diluted $ (3.97) N/A N/A
The fair value of each Class B option grant is estimated on the date of grant using the Black-Scholes option-pric-
ing model. The assumptions used were the same as those for Class A.