Electronic Arts 2001 Annual Report Download - page 26
Download and view the complete annual report
Please find page 26 of the 2001 Electronic Arts annual report below. You can navigate through the pages in the report by either clicking on the pages listed below, or by using the keyword search tool below to find specific information within the annual report.-
 1
1 -
2
-
3
-
4
-
5
-
6
-
7
-
8
-
9
-
10
-
11
-
12
-
13
-
14
-
15
-
 16
16 -
 17
17 -
 18
18 -
 19
19 -
 20
20 -
 21
21 -
 22
22 -
 23
23 -
 24
24 -
 25
25 -
 26
26 -
 27
27 -
 28
28 -
 29
29 -
 30
30 -
 31
31 -
 32
32 -
 33
33 -
 34
34 -
 35
35 -
 36
36 -
37
-
38
-
39
-
40
-
41
-
42
-
43
-
44
-
45
-
46
-
47
-
48
-
49
-
50
-
51
-
52
-
53
-
54
-
55
-
56
-
57
-
58
-
59
-
60
-
61
-
62
-
63
-
64
-
65
-
66
-
67
-
68
-
69
-
70
-
71
-
72
 |
 |

24
2001 AR
Online Subscription Revenues
Online subscription revenues are revenues collected for Internet gameplay on our
websites. The increase in online revenues for fiscal 2000 as compared to fiscal 1999 was attributable to the following:
• The average number of paying customers for Ultima Online increased to over 140,000 for fiscal 2000 as com-
pared to over 105,000 in fiscal 1999.
• The increase in paying customers was due to continued strong sales of Ultima Online, the addition of new
events within the Ultima worlds and the release of Ultima Online: The Second Age
™
in October 1998. Ultima
Online: The Second Age added features including new worlds, monsters and an in-game chat feature.
• We established servers for Ultima Online in Europe in June 1999 and in Japan in October 1998. This local dial-in
capability resulted in new customers in those territories for the fiscal 2000, as compared to fiscal 1999.
License, OEM and Other Revenues
The increase in license, OEM and other revenues was primarily due to the following:
• License/OEM revenues increased due to the sales of Game Boy
®
Color titles in fiscal 2000.
• Other revenues decreased primarily due to decreases in 32-bit products, other than PlayStation, as we no longer
publish games for those platforms.
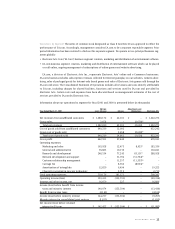
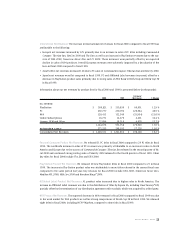
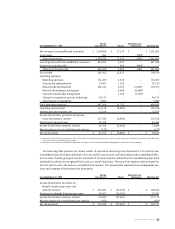
Operations by Segment
Information about our operations by segment for fiscal 2000 and 1999 is presented below
(in thousands):
EA Core Adjustments and
Year Ended March 31, 2000 (excl. EA.com) EA.com Eliminations Electronic Arts
Net revenues from unaffiliated customers $ 1,399,093 $ 20,918 $ – $ 1,420,011
Group sales 2,014 – (2,014)(a) –
Total net revenues 1,401,107 20,918 (2,014) 1,420,011
Cost of goods sold from unaffiliated customers 700,024 4,678 – 704,702
Group cost of goods sold – 2,014 (2,014)(a) –
Total cost of goods sold 700,024 6,692 (2,014) 704,702
Gross profit 701,083 14,226 – 715,309
Operating expenses:
Marketing and sales 185,714 2,897 – 188,611
General and administrative 87,513 4,905 – 92,418
Research and development 205,933 34,716 21,317(b) 261,966
Network development and support – 17,993 (17,993)(b) –
Customer relationship management – 3,324 (3,324)(b) –
Amortization of intangibles 10,866 1,123 – 11,989
Charge for acquired in-process technology 2,670 3,869 – 6,539
Total operating expenses 492,696 68,827 – 561,523
Operating income (loss) 208,387 (54,601) – 153,786
Interest and other income, net 16,017 11 – 16,028
Income (loss) before provision for income
taxes and minority interest 224,404 (54,590) – 169,814
Provision for income taxes 52,642 – – 52,642
Income (loss) before minority interest 171,762 (54,590) – 117,172
Minority interest in consolidated joint venture (421) – – (421)
Net income (loss) $ 171,341 $ (54,590) $ – $ 116,751