Electronic Arts 2001 Annual Report Download - page 24
Download and view the complete annual report
Please find page 24 of the 2001 Electronic Arts annual report below. You can navigate through the pages in the report by either clicking on the pages listed below, or by using the keyword search tool below to find specific information within the annual report.-
 1
1 -
2
-
3
-
4
-
5
-
6
-
7
-
8
-
9
-
10
-
11
-
12
-
13
-
 14
14 -
 15
15 -
 16
16 -
 17
17 -
 18
18 -
 19
19 -
 20
20 -
 21
21 -
 22
22 -
 23
23 -
 24
24 -
 25
25 -
 26
26 -
 27
27 -
 28
28 -
 29
29 -
 30
30 -
 31
31 -
 32
32 -
 33
33 -
 34
34 -
35
-
36
-
37
-
38
-
39
-
40
-
41
-
42
-
43
-
44
-
45
-
46
-
47
-
48
-
49
-
50
-
51
-
52
-
53
-
54
-
55
-
56
-
57
-
58
-
59
-
60
-
61
-
62
-
63
-
64
-
65
-
66
-
67
-
68
-
69
-
70
-
71
-
72
 |
 |

22
2001 AR
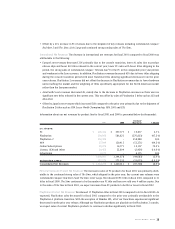
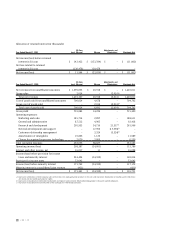
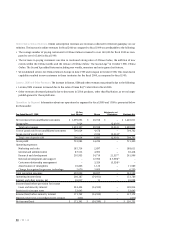
INTEREST AND OTHER INCOME, NET Interest and other income, net, increased in absolute dollars primarily
due to higher interest income as a result of higher average cash balances and investing in higher yielding taxable
securities in the current year. Those gains were partially offset by realized gains on sales of marketable securities
in the prior year.
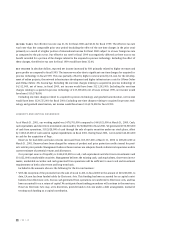
INCOME TAXES Our effective tax rate was 31.0% for fiscal 2001 and fiscal 2000. At March 31, 2001, we generated
a federal income tax net operating loss. A substantial portion of this loss will be utilized in a carryback claim with
the remainder being carried forward. A valuation allowance has not been established on this loss carryforward or
other net deferred tax assets as we believe it is more likely than not that the results of future operations will gen-
erate sufficient taxable income to realize them.
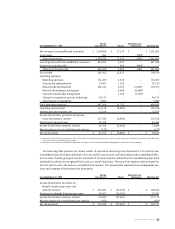
NET INCOME (LOSS) In absolute dollars, reported net income (loss) decreased in fiscal 2001 primarily related to
lower revenues as well as higher costs and expenses compared to the same period last year. The decrease in rev-
enues was primarily due to the beginning of the transition period to next generation console systems. The
increase in expenses was primarily due to increases in development of next generation console products in the
Core business and the investment in EA.com, including expenses to build network and online game products and
to launch our game sites in October 2000.
Excluding goodwill, non-cash compensation and one-time charges in the amount of $17,077,000, net of taxes, for
fiscal 2001, net income would have been $5,995,000. Excluding goodwill, non-cash compensation and one-time
charges in the amount of $13,292,000, net of taxes, for fiscal 2000, net income would have been $130,043,000.
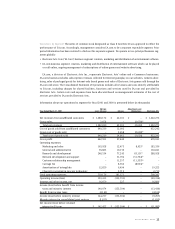
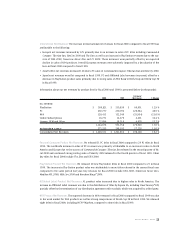
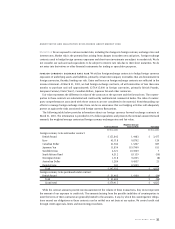
Comparison of Fiscal 2000 to 1999:
Revenues
Information about our net revenues for North America and foreign areas for fiscal 2000 and 1999 is summarized
below (in thousands):
2000 1999 Increase % Change
North America $ 846,637 $ 704,998 $ 141,639 20.1 %
Europe 486,816 436,772 50,044 11.5 %
Asia Pacific 53,187 46,725 6,462 13.8 %
Japan 33,371 33,368 3 0.0 %
International 573,374 516,865 56,509 10.9 %
Consolidated Net Revenues $ 1,420,011 $ 1,221,863 $ 198,148 16.2 %
North America Net Revenues
The increase in North America net revenues for fiscal 2000 compared to fiscal 1999
was primarily attributable to:
• A 52% increase in PC revenues due to strong sales of Command & Conquer: Tiberian Sun, SimCity 3000
™
, as well
as the fourth quarter shipment of The Sims in fiscal 2000.
• A 20% increase in PlayStation revenues due to more titles released during fiscal 2000 including Madden NFL
2000, NBA Live 2000 and Tomorrow Never Dies as compared to fiscal 1999.
• A 17% increase in AL revenues primarily due to the shipment of titles published by Square EA offset by the loss
of an affiliate, Accolade, due to its acquisition by a third party in the first quarter of fiscal 2000.
• These increases were partially offset by an expected decline in sales of N64 products.