Electronic Arts 2001 Annual Report Download - page 40
Download and view the complete annual report
Please find page 40 of the 2001 Electronic Arts annual report below. You can navigate through the pages in the report by either clicking on the pages listed below, or by using the keyword search tool below to find specific information within the annual report.-
 1
1 -
2
-
3
-
4
-
5
-
6
-
7
-
8
-
9
-
10
-
11
-
12
-
13
-
14
-
15
-
16
-
17
-
18
-
19
-
20
-
21
-
22
-
23
-
24
-
25
-
26
-
27
-
28
-
29
-
 30
30 -
 31
31 -
 32
32 -
 33
33 -
 34
34 -
 35
35 -
 36
36 -
 37
37 -
 38
38 -
 39
39 -
 40
40 -
 41
41 -
 42
42 -
 43
43 -
 44
44 -
 45
45 -
 46
46 -
 47
47 -
 48
48 -
 49
49 -
 50
50 -
51
-
52
-
53
-
54
-
55
-
56
-
57
-
58
-
59
-
60
-
61
-
62
-
63
-
64
-
65
-
66
-
67
-
68
-
69
-
70
-
71
-
72
 |
 |

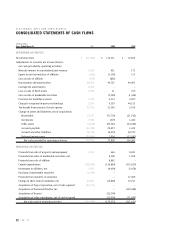
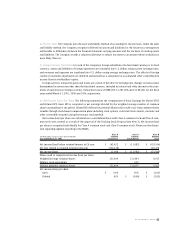
(In thousands)
Years Ended March 31, 2001 2000 1999
OPERATING ACTIVITIES
Net income (loss) $ (11,082) $ 116,751 $ 72,872
Adjustments to reconcile net income (loss) to
net cash provided by operating activities:
Minority interest in consolidated joint venture 1,815 421 172
Equity in net (income) loss of affiliates (820) (1,138) 155
Gain on sale of affiliate (214) (842) –
Depreciation and amortization 69,668 46,725 40,461
Carriage fee amortization 8,933 ––
Loss on sale of fixed assets 1,992 31 729
Gain on sale of marketable securities –(7,528) (1,454)
Provision for doubtful accounts 7,541 6,714 6,027
Charge for acquired in-process technology 2,719 6,539 44,115
Tax benefit from exercise of stock options 25,750 32,563 5,614
Change in assets and liabilities, net of acquisitions:
Receivables 53,775 (77,779) (11,702)
Inventories 7,300 (579) 1,282
Other assets (4,238) (69,727) (24,266)
Accounts payable (27,476) 29,673 1,622
Accrued and other liabilities 91,356 (6,919) 32,797
Deferred income taxes (33,080) 2,994 (12,042)
Net cash provided by operating activities 193,939 77,899 156,382
INVESTING ACTIVITIES
Proceeds from sale of property and equipment 4,134 444 8,281
Proceeds from sales of marketable securities, net –8,598 1,818
Proceeds from sale of affiliate –8,842 –
Capital expenditures (120,347) (134,884) (115,820)
Investment in affiliates, net 1,662 (4,099) (5,478)
Purchase of marketable securities (2,479) ––
Proceeds from maturity of securities –– 17,306
Change in short-term investments, net 46,907 (13,860) 76,755
Acquisition of Pogo Corporation, net of cash acquired (42,571) ––
Acquisition of Westwood Studios, Inc. –– (122,688)
Acquisition of Kesmai –(22,500) –
Acquisition of other subsidiaries, net of cash acquired –(22,096) (11,805)
Net cash used in investing activities (112,694) (179,555) (151,631)
38
2001 AR
ELECTRONIC ARTS AND SUBSIDIARIES
CONSOLIDATED STATEMENTS OF CASH FLOWS