Electronic Arts 2001 Annual Report Download - page 69
Download and view the complete annual report
Please find page 69 of the 2001 Electronic Arts annual report below. You can navigate through the pages in the report by either clicking on the pages listed below, or by using the keyword search tool below to find specific information within the annual report.-
 1
1 -
2
-
3
-
4
-
5
-
6
-
7
-
8
-
9
-
10
-
11
-
12
-
13
-
14
-
15
-
16
-
17
-
18
-
19
-
20
-
21
-
22
-
23
-
24
-
25
-
26
-
27
-
28
-
29
-
30
-
31
-
32
-
33
-
34
-
35
-
36
-
37
-
38
-
39
-
40
-
41
-
42
-
43
-
44
-
45
-
46
-
47
-
48
-
49
-
50
-
51
-
52
-
53
-
54
-
55
-
56
-
57
-
58
-
 59
59 -
 60
60 -
 61
61 -
 62
62 -
 63
63 -
 64
64 -
 65
65 -
 66
66 -
 67
67 -
 68
68 -
 69
69 -
 70
70 -
 71
71 -
 72
72
 |
 |

ELECTRONIC ARTS
67
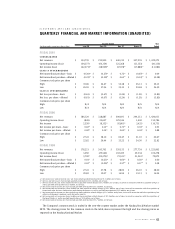
Quarter Ended Year
(In thousands, except per share data)
June 30 Sept. 30 Dec. 31 March 31 Ended
FISCAL 2001
CONSOLIDATED
Net revenues $ 154,799 $ 219,900 $ 640,319 $ 307,255 $ 1,322,273
Operating income (loss) (64,377) (60,154) 125,368 (31,153) (30,316)
Net income (loss) (42,271)
(a)
(38,909)
(b)
87,978
(a)
(17,880)
(c)
(11,082)
CLASS A STOCKHOLDERS
Net income (loss) per share – basic $ (0.30)
(a)
$ (0.27)
(b)
$ 0.72
(a)
$ (0.07)
(c)
$ 0.09
Net income (loss) per share – diluted $ (0.33)
(a)
$ (0.30)
(b)
$ 0.63
(a)
$ (0.13)
(c)
$ (0.08)
Common stock price per share
High $ 39.06 $ 54.47 $ 55.38 $ 56.13 $ 56.13
Low $ 26.59 $ 37.06 $ 35.19 $ 29.84 $ 26.59
CLASS B STOCKHOLDERS
Net loss per share – basic $ (0.61) $ (0.67) $ (1.24) $ (1.31) $ (3.83)
Net loss per share – diluted $ (0.61) $ (0.67) $ (1.24) $ (1.31) $ (3.83)
Common stock price per share
High N/A N/A N/A N/A N/A
Low N/A N/A N/A N/A N/A
FISCAL 2000
Net revenues $ 186,120 $ 338,887 $ 600,691 $ 294,313 $ 1,420,011
Operating income (loss) (849) 23,697 129,536 1,402 153,786
Net income 2,326
(d)
18,132
(d)
92,861
(d)
3,432
(e)
116,751
Net income per share – basic $ 0.02
(d)
$ 0.15
(d)
$ 0.73
(d)
$ 0.03
(e)
$ 0.93
Net income per share – diluted $ 0.02
(d)
$ 0.14
(d)
$ 0.69
(d)
$ 0.03
(e)
$ 0.88
Common stock price per share
High $ 27.41 $ 38.10 $ 60.47 $ 51.10 $ 60.47
Low $ 22.82 $ 26.44 $ 33.22 $ 34.50 $ 22.82
FISCAL 1999
Net revenues $ 178,221 $ 245,763 $ 520,155 $ 277,724 $ 1,221,863
Operating income (loss) 3,050 (29,545) 102,439 29,334 105,278
Net income (loss) 3,700
(f)
(25,273)
(g)
72,531
(h)
21,914
(h)
72,872
Net income (loss) per share – basic $ 0.03
(f)
$ (0.21)
(g)
$ 0.60
(h)
$ 0.18
(h)
$ 0.60
Net income (loss) per share – diluted $ 0.03
(f)
$ (0.20)
(g)
$ 0.57
(h)
$ 0.17
(h)
$ 0.58
Common stock price per share
High $ 27.41 $ 27.78 $ 28.00 $ 26.10 $ 28.00
Low $ 20.82 $ 19.07 $ 16.94 $ 19.13 $ 16.94
(a) Net income (loss) and net income (loss) per share include goodwill amortization of $3.2 million, net of taxes.
(b) Net loss and net loss per share include goodwill amortization of $3.3 million, net of taxes.
(c) Net loss and net loss per share include one-time acquisition related charges of $1.9 million, net of taxes, incurred in connection with the acquisition of Pogo as
well as goodwill amortization of $3.6 million, net of taxes.
(d) Net income and net income per share include goodwill amortization of $1.8 million, net of taxes.
(e) Net income and net income per share include one-time acquisition related charges of $4.5 million, net of taxes, incurred in connection with the acquisition of
Kesmai and other business combinations made during the quarter as well as goodwill amortization of $2.9 million, net of taxes.
(f) Net income and net income per share include one-time acquisition related charges of $1.6 million, net of taxes, incurred in connection with the acquisition of two
software development companies made during the quarter.
(g) Net income and net income per share include one-time acquisition related charges of $35.9 million, net of taxes, incurred in connection with the acquisition of
Westwood Studios as well as goodwill amortization of $0.6 million, net of taxes.
(h) Net income and net income per share include goodwill amortization of $1.7 million, net of taxes.
The Company’s common stock is traded in the over-the-counter market under the Nasdaq Stock Market symbol
ERTS. The closing prices for the common stock in the table above represent the high and low closing prices as
reported on the Nasdaq National Market.
ELECTRONIC ARTS AND SUBSIDIARIES
QUARTERLY FINANCIAL AND MARKET INFORMATION (UNAUDITED)