Electronic Arts 2001 Annual Report Download - page 28
Download and view the complete annual report
Please find page 28 of the 2001 Electronic Arts annual report below. You can navigate through the pages in the report by either clicking on the pages listed below, or by using the keyword search tool below to find specific information within the annual report.-
 1
1 -
2
-
3
-
4
-
5
-
6
-
7
-
8
-
9
-
10
-
11
-
12
-
13
-
14
-
15
-
16
-
17
-
 18
18 -
 19
19 -
 20
20 -
 21
21 -
 22
22 -
 23
23 -
 24
24 -
 25
25 -
 26
26 -
 27
27 -
 28
28 -
 29
29 -
 30
30 -
 31
31 -
 32
32 -
 33
33 -
 34
34 -
 35
35 -
 36
36 -
 37
37 -
 38
38 -
39
-
40
-
41
-
42
-
43
-
44
-
45
-
46
-
47
-
48
-
49
-
50
-
51
-
52
-
53
-
54
-
55
-
56
-
57
-
58
-
59
-
60
-
61
-
62
-
63
-
64
-
65
-
66
-
67
-
68
-
69
-
70
-
71
-
72
 |
 |

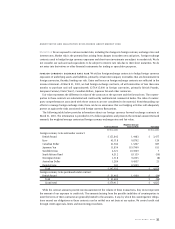
26
2001 AR
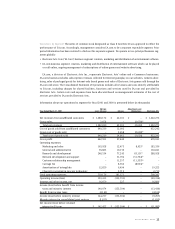
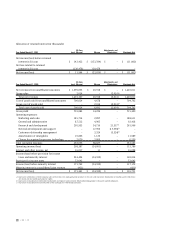
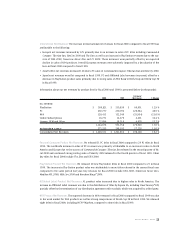
EA Core Adjustments and
Year Ended March 31, 1999 (excl. EA.com) EA.com Eliminations Electronic Arts
Income (loss) before provision for
(benefit from) income taxes and
minority interest $ 127,338 $ (8,880) $ – $ 118,458
Provision for (benefit from) income taxes 48,256 (2,842) – 45,414
Income (loss) before minority interest 79,082 (6,038) – 73,044
Minority interest in consolidated joint venture (172) – – (172)
Net income (loss) $ 78,910 $ (6,038) $ – $ 72,872
Costs and Expenses, Interest and Other Income, Net, Income Taxes
and Net Income for both EA Core and EA.com Segments
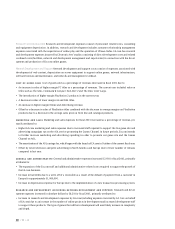
COST OF GOODS SOLD Cost of goods sold as a percentage of revenues decreased in fiscal 2000 due to:
• An increase in sales of higher margin PC titles as a percentage of revenues.
• An increase in sales of higher margin AL co-published titles which make up a greater amount of total AL rev-
enues for fiscal 2000 as compared to fiscal 1999.
• A decrease in sales of lower margin N64 titles.
• Higher average margin for PC sales due to higher percentage of revenues from internally developed and
Intellectual Property owned titles, such as Command & Conquer: Tiberian Sun, SimCity 3000 and The Sims.
• Offset by a decrease, as a percentage of revenues, of PlayStation products.
MARKETING AND SALES Marketing and sales expenses increased in absolute dollars by 15% primarily attributed to:
• Increased print, Internet and television advertising to support new releases.
• Increased cooperative advertising associated with higher revenues in North America and Europe as compared to
the prior year.
• Additional headcount related to the continued expansion of our worldwide distribution business.
GENERAL AND ADMINISTRATIVE General and administrative expenses increased in absolute dollars by 21% pri-
marily due to:
• An increase in payroll and occupancy costs to support the increase in growth in North America and Europe.
• Increased general and administrative spending for EA.com. EA.com expanded its staff and incurred additional
administrative related costs required to support growth of the business.
RESEARCH AND DEVELOPMENT The increase in absolute dollars by 28% for research and development expenses
(excluding Network Development and Support) was due to:
• Increased research and development spending due to the ongoing investment in our online business. EA.com
increased the number of online projects in development and increased development staff.
• Additional headcount-related expenses attributable to the increased in-house development capacity and a higher
number of SKUs released in fiscal 2000.
• An increase in development spending for next generation console products including development for the
PlayStation 2 console.
We released a total of 69 new products in fiscal 2000 compared to 59 in fiscal 1999.