Electronic Arts 2001 Annual Report Download - page 64
Download and view the complete annual report
Please find page 64 of the 2001 Electronic Arts annual report below. You can navigate through the pages in the report by either clicking on the pages listed below, or by using the keyword search tool below to find specific information within the annual report.-
 1
1 -
2
-
3
-
4
-
5
-
6
-
7
-
8
-
9
-
10
-
11
-
12
-
13
-
14
-
15
-
16
-
17
-
18
-
19
-
20
-
21
-
22
-
23
-
24
-
25
-
26
-
27
-
28
-
29
-
30
-
31
-
32
-
33
-
34
-
35
-
36
-
37
-
38
-
39
-
40
-
41
-
42
-
43
-
44
-
45
-
46
-
47
-
48
-
49
-
50
-
51
-
52
-
53
-
 54
54 -
 55
55 -
 56
56 -
 57
57 -
 58
58 -
 59
59 -
 60
60 -
 61
61 -
 62
62 -
 63
63 -
 64
64 -
 65
65 -
 66
66 -
 67
67 -
 68
68 -
 69
69 -
 70
70 -
 71
71 -
 72
72
 |
 |

62
2001 AR
As a result of the issuance of Class B common stock, which is intended to reflect the performance of EA.com,
management considers EA.com to be a separate reportable segment. Accordingly, prior period information has
been restated to disclose separate segments. The Company operates in two principal business segments globally:
• Electronic Arts core (“EA Core”) business segment: creation, marketing and distribution of entertainment software.
• EA.com business segment: creation, marketing and distribution of entertainment software which can be played
or sold online, ongoing management of subscriptions of online games and website advertising.
Please see the discussion regarding segment reporting in the MD&A.
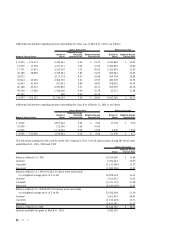
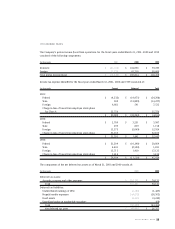
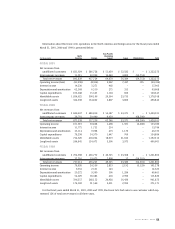
Information about Electronic Arts business segments is presented below for the fiscal years ended March 31,
2001, 2000 and 1999 (in thousands):
EA Core Adjustments and
Year Ended March 31, 2001 (excl. EA.com) EA.com Eliminations Electronic Arts
Net revenues from unaffiliated customers $ 1,280,172 $ 42,101 $ – $ 1,322,273
Group sales 2,658 – (2,658)(a) –
Total net revenues 1,282,830 42,101 (2,658) 1,322,273
Cost of goods sold from unaffiliated customers 640,239 12,003 – 652,242
Group cost of goods sold – 2,658 (2,658)(a) –
Total cost of goods sold 640,239 14,661 (2,658) 652,242
Gross profit 642,591 27,440 – 670,031
Operating expenses:
Marketing and sales 163,928 12,475 8,933(c) 185,336
General and administrative 93,885 10,156 – 104,041
Research and development 248,534 77,243 63,151(b) 388,928
Network development and support – 51,794 (51,794)(b) –
Customer relationship management – 11,357 (11,357)(b) –
Carriage fee – 8,933 (8,933)(c) –
Amortization of intangibles 12,829 6,494 – 19,323
Charge for acquired in-process technology – 2,719 – 2,719
Total operating expenses 519,176 181,171 – 700,347
Operating income (loss) 123,415 (153,731) – (30,316)
Interest and other income, net 16,659 227 – 16,886
Income (loss) before benefit from income
taxes and minority interest 140,074 (153,504) – (13,430)
Benefit from income taxes (4,163) – – (4,163)
Income (loss) before minority interest 144,237 (153,504) – (9,267)
Minority interest in consolidated joint venture (1,815) – – (1,815)
Net income (loss) before retained
interest in EA.com $ 142,422 $ (153,504) $ – $ (11,082)
Interest income $ 17,809 $ 94 $ – $ 17,903
Depreciation and amortization 45,382 24,286 – 69,668
Identifiable assets 1,167,846 211,072 – 1,378,918
Capital expenditures 51,460 68,887 – 120,347