Electronic Arts 2016 Annual Report Download - page 121
Download and view the complete annual report
Please find page 121 of the 2016 Electronic Arts annual report below. You can navigate through the pages in the report by either clicking on the pages listed below, or by using the keyword search tool below to find specific information within the annual report.-
 1
1 -
2
-
3
-
4
-
5
-
6
-
7
-
8
-
9
-
10
-
11
-
12
-
13
-
14
-
15
-
16
-
17
-
18
-
19
-
20
-
21
-
22
-
23
-
24
-
25
-
26
-
27
-
28
-
29
-
30
-
31
-
32
-
33
-
34
-
35
-
36
-
37
-
38
-
39
-
40
-
41
-
42
-
43
-
44
-
45
-
46
-
47
-
48
-
49
-
50
-
51
-
52
-
53
-
54
-
55
-
56
-
57
-
58
-
59
-
60
-
61
-
62
-
63
-
64
-
65
-
66
-
67
-
68
-
69
-
70
-
71
-
72
-
73
-
74
-
75
-
76
-
77
-
78
-
79
-
80
-
81
-
82
-
83
-
84
-
85
-
86
-
87
-
88
-
89
-
90
-
91
-
92
-
93
-
94
-
95
-
96
-
97
-
98
-
99
-
100
-
101
-
102
-
103
-
104
-
105
-
106
-
107
-
108
-
109
-
110
-
 111
111 -
 112
112 -
 113
113 -
 114
114 -
 115
115 -
 116
116 -
 117
117 -
 118
118 -
 119
119 -
 120
120 -
 121
121 -
 122
122 -
 123
123 -
 124
124 -
 125
125 -
 126
126 -
 127
127 -
 128
128 -
 129
129 -
 130
130 -
 131
131 -
132
-
133
-
134
-
135
-
136
-
137
-
138
-
139
-
140
-
141
-
142
-
143
-
144
-
145
-
146
-
147
-
148
-
149
-
150
-
151
-
152
-
153
-
154
-
155
-
156
-
157
-
158
-
159
-
160
-
161
-
162
-
163
-
164
-
165
-
166
-
167
-
168
-
169
-
170
-
171
-
172
-
173
-
174
-
175
-
176
-
177
-
178
-
179
-
180
-
181
-
182
-
183
-
184
-
185
-
186
-
187
-
188
 |
 |

Annual Report
Service and Other Revenue
For fiscal year 2016, service and other revenue was $1,899 million, primarily driven by FIFA Ultimate Team and
Star Wars: The Old Republic. Service and other revenue for fiscal year 2016 decreased $48 million, or 2 percent,
as compared to fiscal year 2015. This decrease was driven by a $421 million decrease primarily from Titanfall
and Battlefield 4 Premium. This decrease was partially offset by a $373 million increase primarily from the
Madden NFL franchise, Need for Speed 2015 and SimCity BuildIt.
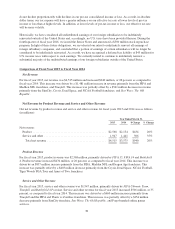
Cost of Revenue
Cost of revenue for fiscal years 2016 and 2015 was as follows (in millions):
March 31,
2016
%of
Related
Net Revenue
March 31,
2015
%of
Related Net
Revenue
%
Change
Change as a
% of Related
Net Revenue
Cost of revenue:
Product ......................... $ 938 37.6% $1,028 40.0% (8.8)% (2.4)%
Service and other ................. 416 21.9% 401 20.6% 3.7% 1.3%
Total cost of revenue ............ $1,354 30.8% $1,429 31.7% (5.2)% (0.9)%
Cost of Product Revenue
Cost of product revenue consists of (1) inventory costs, (2) certain royalty expenses for celebrities, professional
sports, movie studios and other organizations, and independent software developers, (3) manufacturing royalties,
net of volume discounts and other vendor reimbursements, (4) expenses for defective products, (5) write-offs of
post launch prepaid royalty costs and losses on previously unrecognized licensed intellectual property
commitments, (6) amortization of certain intangible assets, (7) personnel-related costs, and (8) warehousing and
distribution costs. We generally recognize volume discounts when they are earned from the manufacturer
(typically in connection with the achievement of unit-based milestones); whereas other vendor reimbursements
are generally recognized as the related revenue is recognized.
Cost of product revenue decreased by $90 million, or 8.8 percent in fiscal year 2016, as compared to fiscal year
2015. Cost of product revenue decreased primarily due to a loss of $122 million on previously unrecognized
licensed intellectual property commitment recognized during fiscal year 2015. Excluding the impact of the $122
million loss, cost of product revenue increased $32 million, or 4 percent, primarily due to an increase in royalty
costs driven by Star Wars Battlefront, which was launched during the third quarter of fiscal year 2016, with no
comparable royalty-bearing title launched during fiscal year 2015.
Cost of Service and Other Revenue
Cost of service and other revenue consists primarily of (1) royalty costs, (2) data center, bandwidth and server
costs associated with hosting our online games and websites, (3) inventory costs, (4) platform processing fees
from operating our website-based games on third party platforms, and (5) credit card fees associated with our
service revenue.
Cost of service and other revenue increased by $15 million, or 3.7 percent in fiscal year 2016, as compared to
fiscal year 2015. The increase was primarily due to an increase in inventory costs due to the launch of Need for
Speed 2015 during fiscal year 2016, offset by a decrease in inventory costs due to Titanfall, launched for the
Xbox 360 during fiscal year 2015.
Total Cost of Revenue as a Percentage of Total Net Revenue
During the fiscal year ended March 31, 2016, total cost of revenue as a percentage of total net revenue remained
relatively consistent as compared to the fiscal year ended March 31, 2015.
35