Electronic Arts 2016 Annual Report Download - page 173
Download and view the complete annual report
Please find page 173 of the 2016 Electronic Arts annual report below. You can navigate through the pages in the report by either clicking on the pages listed below, or by using the keyword search tool below to find specific information within the annual report.-
 1
1 -
2
-
3
-
4
-
5
-
6
-
7
-
8
-
9
-
10
-
11
-
12
-
13
-
14
-
15
-
16
-
17
-
18
-
19
-
20
-
21
-
22
-
23
-
24
-
25
-
26
-
27
-
28
-
29
-
30
-
31
-
32
-
33
-
34
-
35
-
36
-
37
-
38
-
39
-
40
-
41
-
42
-
43
-
44
-
45
-
46
-
47
-
48
-
49
-
50
-
51
-
52
-
53
-
54
-
55
-
56
-
57
-
58
-
59
-
60
-
61
-
62
-
63
-
64
-
65
-
66
-
67
-
68
-
69
-
70
-
71
-
72
-
73
-
74
-
75
-
76
-
77
-
78
-
79
-
80
-
81
-
82
-
83
-
84
-
85
-
86
-
87
-
88
-
89
-
90
-
91
-
92
-
93
-
94
-
95
-
96
-
97
-
98
-
99
-
100
-
101
-
102
-
103
-
104
-
105
-
106
-
107
-
108
-
109
-
110
-
111
-
112
-
113
-
114
-
115
-
116
-
117
-
118
-
119
-
120
-
121
-
122
-
123
-
124
-
125
-
126
-
127
-
128
-
129
-
130
-
131
-
132
-
133
-
134
-
135
-
136
-
137
-
138
-
139
-
140
-
141
-
142
-
143
-
144
-
145
-
146
-
147
-
148
-
149
-
150
-
151
-
152
-
153
-
154
-
155
-
156
-
157
-
158
-
159
-
160
-
161
-
162
-
 163
163 -
 164
164 -
 165
165 -
 166
166 -
 167
167 -
 168
168 -
 169
169 -
 170
170 -
 171
171 -
 172
172 -
 173
173 -
 174
174 -
 175
175 -
 176
176 -
 177
177 -
 178
178 -
 179
179 -
 180
180 -
 181
181 -
 182
182 -
 183
183 -
184
-
185
-
186
-
187
-
188
 |
 |

Annual Report
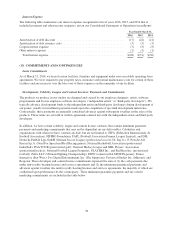
The following table summarizes the financial performance of our current segment operating profit and a
reconciliation to our consolidated operating income for the fiscal years ended March 31, 2016, 2015 and 2014 (in
millions):
Year Ended March 31,
2016 2015 2014
Segment:
Net revenue before revenue deferral ................................... $4,566 $ 4,319 $ 4,021
Depreciation ...................................................... (119) (126) (126)
Other expenses .................................................... (3,147) (3,117) (3,178)
Segment operating profit ............................................ 1,300 1,076 717
Reconciliation to consolidated operating income:
Other:
Revenue deferral .................................................. (3,783) (3,536) (3,350)
Recognition of revenue deferral ....................................... 3,613 3,732 2,904
Amortization of intangibles .......................................... (54) (66) (76)
Acquisition-related contingent consideration ............................ — 3 35
Restructuring and other charges ....................................... — — 1
Stock-based compensation ........................................... (178) (144) (150)
Loss on licensed intellectual property commitment ....................... (122) —
Other expenses .................................................... — 5 (48)
Consolidated operating income ......................................... $ 898 $ 948 $ 33
Our segment profit differs from consolidated operating income primarily due to the exclusion of (1) the deferral
of net revenue related to online-enabled games (see Note 10 for additional information regarding deferred net
revenue (online-enabled games)), (2) certain non-cash costs such as stock-based compensation, (3) acquisition-
related expenses such as amortization of intangibles and acquisition-related contingent consideration, and
(4) other significant non-recurring costs that may not be indicative of the company’s core business, operating
results or future outlook. Our CODM reviews assets on a consolidated basis and not on a segment basis.
Net revenue before revenue deferral is used internally to evaluate our operating performance, when planning,
forecasting and analyzing future periods, and when assessing the performance of our management team. Net
revenue before revenue deferral excludes the impact of revenue deferral and the recognition of revenue deferral
on net revenue related to sales of online-enabled games and content.
Revenue deferral generally relates to sales of online-enabled games and content for which we do not have VSOE
for unspecified updates to be delivered after the initial sale or for which we have a continuing service obligation.
Fluctuations in the revenue deferral are largely dependent upon the amounts of products that we sell with the
online features and services previously discussed, while the recognition of revenue deferral for a period is also
dependent upon (1) the amount deferred, (2) the period of time the software-related offerings and service
obligations are to be provided, and (3) the timing of the sale. Our sales are generally deferred and recognized
over an estimated nine-month period beginning in the month after shipment for physical games sold through
retail and an estimated six-month period for digitally delivered games and content, and therefore, the related
revenue recognized during any fiscal quarter is primarily due to sales that occurred during the preceding six-
month period for digitally delivered games and content, and the preceding nine-month period for physical games
sold through retail.
87