Electronic Arts 2016 Annual Report Download - page 150
Download and view the complete annual report
Please find page 150 of the 2016 Electronic Arts annual report below. You can navigate through the pages in the report by either clicking on the pages listed below, or by using the keyword search tool below to find specific information within the annual report.-
 1
1 -
2
-
3
-
4
-
5
-
6
-
7
-
8
-
9
-
10
-
11
-
12
-
13
-
14
-
15
-
16
-
17
-
18
-
19
-
20
-
21
-
22
-
23
-
24
-
25
-
26
-
27
-
28
-
29
-
30
-
31
-
32
-
33
-
34
-
35
-
36
-
37
-
38
-
39
-
40
-
41
-
42
-
43
-
44
-
45
-
46
-
47
-
48
-
49
-
50
-
51
-
52
-
53
-
54
-
55
-
56
-
57
-
58
-
59
-
60
-
61
-
62
-
63
-
64
-
65
-
66
-
67
-
68
-
69
-
70
-
71
-
72
-
73
-
74
-
75
-
76
-
77
-
78
-
79
-
80
-
81
-
82
-
83
-
84
-
85
-
86
-
87
-
88
-
89
-
90
-
91
-
92
-
93
-
94
-
95
-
96
-
97
-
98
-
99
-
100
-
101
-
102
-
103
-
104
-
105
-
106
-
107
-
108
-
109
-
110
-
111
-
112
-
113
-
114
-
115
-
116
-
117
-
118
-
119
-
120
-
121
-
122
-
123
-
124
-
125
-
126
-
127
-
128
-
129
-
130
-
131
-
132
-
133
-
134
-
135
-
136
-
137
-
138
-
139
-
 140
140 -
 141
141 -
 142
142 -
 143
143 -
 144
144 -
 145
145 -
 146
146 -
 147
147 -
 148
148 -
 149
149 -
 150
150 -
 151
151 -
 152
152 -
 153
153 -
 154
154 -
 155
155 -
 156
156 -
 157
157 -
 158
158 -
 159
159 -
 160
160 -
161
-
162
-
163
-
164
-
165
-
166
-
167
-
168
-
169
-
170
-
171
-
172
-
173
-
174
-
175
-
176
-
177
-
178
-
179
-
180
-
181
-
182
-
183
-
184
-
185
-
186
-
187
-
188
 |
 |

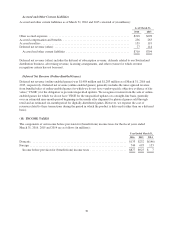
Total gross notional amounts and fair values for currency derivatives with cash flow hedge accounting
designation are as follows (in millions):
As of March 31, 2016 As of March 31, 2015
Notional
Amount
Fair Value Notional
Amount
Fair Value
Asset Liability Asset Liability
Forward contracts to purchase ........................ $148 $ 5 $1 $108 $— $8
Forward contracts to sell ............................ $685 $11 $9 $508 $18 $1
The net impact of the effective portion of gains and losses from our cash flow hedging activities in our
Consolidated Statements of Operations for the fiscal year ended March 31, 2016 was a gain of $12 million and a
loss of $11 million and $9 million for the fiscal years ended March 31, 2015 and 2014, respectively.
During fiscal years ended March 31, 2016, 2015 and 2014, we reclassified an immaterial amount of the
ineffective portion of gains or losses resulting from changes in fair value into interest and other income
(expense), net.
The amount excluded from the assessment of hedge effectiveness during fiscal years ended March 31, 2016,
2015 and 2014 and recognized in interest and other income (expense), net, was immaterial.
Balance Sheet Hedging Activities
Our foreign currency forward contracts that are not designated as hedging instruments are accounted for as
derivatives whereby the fair value of the contracts are reported as other current assets or accrued and other
current liabilities on our Consolidated Balance Sheets, and gains and losses resulting from changes in the fair
value are reported in interest and other income (expense), net, in our Consolidated Statements of Operations. The
gains and losses on these foreign currency forward contracts generally offset the gains and losses in the
underlying foreign-currency-denominated monetary assets and liabilities, which are also reported in interest and
other income (expense), net, in our Consolidated Statements of Operations. The fair value of our foreign currency
forward contracts was measured using Level 2 inputs.
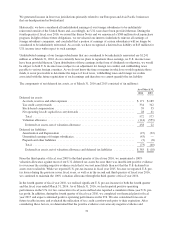
Total gross notional amounts and fair values for currency derivatives that are not designated as hedging
instruments are accounted for as follows (in millions):
As of March 31, 2016 As of March 31, 2015
Notional
Amount
Fair Value Notional
Amount
Fair Value
Asset Liability Asset Liability
Forward contracts to purchase ........................ $108 $— $— $ 99 $— $—
Forward contracts to sell ............................ $159 $— $— $173 $— $—
The effect of foreign currency forward contracts not designated as hedging instruments in our Consolidated
Statements of Operations for the fiscal years ended March 31, 2016, 2015 and 2014, was as follows (in millions):
Statement of Operations
Classification
Amount of Gain (Loss) Recognized in the
Statement of Operations
Year Ended March 31,
2016 2015 2014
Foreign currency forward contracts not
designated as hedging instruments .........
Interest and other income
(expense), net
$16 $58 $(5)
64