Electronic Arts 2016 Annual Report Download - page 149
Download and view the complete annual report
Please find page 149 of the 2016 Electronic Arts annual report below. You can navigate through the pages in the report by either clicking on the pages listed below, or by using the keyword search tool below to find specific information within the annual report.-
 1
1 -
2
-
3
-
4
-
5
-
6
-
7
-
8
-
9
-
10
-
11
-
12
-
13
-
14
-
15
-
16
-
17
-
18
-
19
-
20
-
21
-
22
-
23
-
24
-
25
-
26
-
27
-
28
-
29
-
30
-
31
-
32
-
33
-
34
-
35
-
36
-
37
-
38
-
39
-
40
-
41
-
42
-
43
-
44
-
45
-
46
-
47
-
48
-
49
-
50
-
51
-
52
-
53
-
54
-
55
-
56
-
57
-
58
-
59
-
60
-
61
-
62
-
63
-
64
-
65
-
66
-
67
-
68
-
69
-
70
-
71
-
72
-
73
-
74
-
75
-
76
-
77
-
78
-
79
-
80
-
81
-
82
-
83
-
84
-
85
-
86
-
87
-
88
-
89
-
90
-
91
-
92
-
93
-
94
-
95
-
96
-
97
-
98
-
99
-
100
-
101
-
102
-
103
-
104
-
105
-
106
-
107
-
108
-
109
-
110
-
111
-
112
-
113
-
114
-
115
-
116
-
117
-
118
-
119
-
120
-
121
-
122
-
123
-
124
-
125
-
126
-
127
-
128
-
129
-
130
-
131
-
132
-
133
-
134
-
135
-
136
-
137
-
138
-
 139
139 -
 140
140 -
 141
141 -
 142
142 -
 143
143 -
 144
144 -
 145
145 -
 146
146 -
 147
147 -
 148
148 -
 149
149 -
 150
150 -
 151
151 -
 152
152 -
 153
153 -
 154
154 -
 155
155 -
 156
156 -
 157
157 -
 158
158 -
 159
159 -
160
-
161
-
162
-
163
-
164
-
165
-
166
-
167
-
168
-
169
-
170
-
171
-
172
-
173
-
174
-
175
-
176
-
177
-
178
-
179
-
180
-
181
-
182
-
183
-
184
-
185
-
186
-
187
-
188
 |
 |

Annual Report
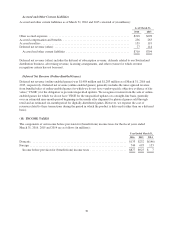
The following table summarizes the amortized cost and fair value of our short-term investments, classified by
stated maturity as of March 31, 2016 and 2015 (in millions):
As of March 31, 2016 As of March 31, 2015
Amortized
Cost
Fair
Value
Amortized
Cost
Fair
Value
Short-term investments
Due in 1 year or less ....................................... $ 571 $ 571 $417 $417
Due in 1-2 years .......................................... 461 462 281 281
Due in 2-3 years .......................................... 295 296 244 245
Due in 3-4 years .......................................... 12 12 10 10
Short-term investments ................................... $1,339 $1,341 $952 $953
(4) DERIVATIVE FINANCIAL INSTRUMENTS
The assets or liabilities associated with our derivative instruments and hedging activities are recorded at fair
value in other current assets/other assets, or accrued and other current liabilities/other liabilities, respectively, on
our Consolidated Balance Sheets. As discussed below, the accounting for gains and losses resulting from changes
in fair value depends on the use of the derivative instrument and whether it is designated and qualifies for hedge
accounting.
We transact business in various foreign currencies and have significant international sales and expenses
denominated in foreign currencies, subjecting us to foreign currency risk. We purchase foreign currency forward
contracts, generally with maturities of 18 months or less, to reduce the volatility of cash flows primarily related
to forecasted revenue and expenses denominated in certain foreign currencies. Our cash flow risks are primarily
related to fluctuations in the Euro, British pound sterling, Canadian dollar, Swedish krona, Australian dollar,
Chinese yuan and South Korean won. In addition, we utilize foreign currency forward contracts to mitigate
foreign exchange rate risk associated with foreign-currency-denominated monetary assets and liabilities,
primarily intercompany receivables and payables. The foreign currency forward contracts not designated as
hedging instruments generally have a contractual term of approximately 3 months or less and are transacted near
month-end. We do not use foreign currency forward contracts for speculative trading purposes.
Cash Flow Hedging Activities
Certain of our forward contracts are designated and qualify as cash flow hedges. The effectiveness of the cash
flow hedge contracts, including time value, is assessed monthly using regression analysis, as well as other timing
and probability criteria. To qualify for hedge accounting treatment, all hedging relationships are formally
documented at the inception of the hedges and must be highly effective in offsetting changes to future cash flows
on hedged transactions. The derivative assets or liabilities associated with our hedging activities are recorded at
fair value in other current assets/other assets, or accrued and other current liabilities/other liabilities, respectively,
on our Consolidated Balance Sheets. The effective portion of gains or losses resulting from changes in the fair
value of these hedges is initially reported, net of tax, as a component of accumulated other comprehensive
income (loss) in stockholders’ equity. The gross amount of the effective portion of gains or losses resulting from
changes in the fair value of these hedges is subsequently reclassified into net revenue or research and
development expenses, as appropriate, in the period when the forecasted transaction is recognized in our
Consolidated Statements of Operations. In the event that the gains or losses in accumulated other comprehensive
income (loss) are deemed to be ineffective, the ineffective portion of gains or losses resulting from changes in
fair value, if any, is reclassified to interest and other income (expense), net, in our Consolidated Statements of
Operations. In the event that the underlying forecasted transactions do not occur, or it becomes remote that they
will occur, within the defined hedge period, the gains or losses on the related cash flow hedges are reclassified
from accumulated other comprehensive income (loss) to interest and other income (expense), net, in our
Consolidated Statements of Operations.
63