Electronic Arts 2016 Annual Report Download - page 60
Download and view the complete annual report
Please find page 60 of the 2016 Electronic Arts annual report below. You can navigate through the pages in the report by either clicking on the pages listed below, or by using the keyword search tool below to find specific information within the annual report.-
 1
1 -
2
-
3
-
4
-
5
-
6
-
7
-
8
-
9
-
10
-
11
-
12
-
13
-
14
-
15
-
16
-
17
-
18
-
19
-
20
-
21
-
22
-
23
-
24
-
25
-
26
-
27
-
28
-
29
-
30
-
31
-
32
-
33
-
34
-
35
-
36
-
37
-
38
-
39
-
40
-
41
-
42
-
43
-
44
-
45
-
46
-
47
-
48
-
49
-
 50
50 -
 51
51 -
 52
52 -
 53
53 -
 54
54 -
 55
55 -
 56
56 -
 57
57 -
 58
58 -
 59
59 -
 60
60 -
 61
61 -
 62
62 -
 63
63 -
 64
64 -
 65
65 -
 66
66 -
 67
67 -
 68
68 -
 69
69 -
 70
70 -
71
-
72
-
73
-
74
-
75
-
76
-
77
-
78
-
79
-
80
-
81
-
82
-
83
-
84
-
85
-
86
-
87
-
88
-
89
-
90
-
91
-
92
-
93
-
94
-
95
-
96
-
97
-
98
-
99
-
100
-
101
-
102
-
103
-
104
-
105
-
106
-
107
-
108
-
109
-
110
-
111
-
112
-
113
-
114
-
115
-
116
-
117
-
118
-
119
-
120
-
121
-
122
-
123
-
124
-
125
-
126
-
127
-
128
-
129
-
130
-
131
-
132
-
133
-
134
-
135
-
136
-
137
-
138
-
139
-
140
-
141
-
142
-
143
-
144
-
145
-
146
-
147
-
148
-
149
-
150
-
151
-
152
-
153
-
154
-
155
-
156
-
157
-
158
-
159
-
160
-
161
-
162
-
163
-
164
-
165
-
166
-
167
-
168
-
169
-
170
-
171
-
172
-
173
-
174
-
175
-
176
-
177
-
178
-
179
-
180
-
181
-
182
-
183
-
184
-
185
-
186
-
187
-
188
 |
 |

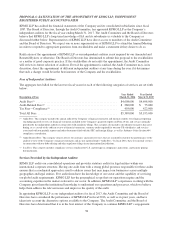
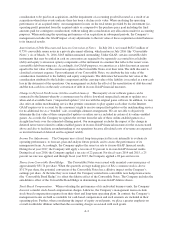
PROPOSAL 3: APPROVAL OF AMENDMENTS TO OUR 2000 EQUITY INCENTIVE PLAN
Our 2000 Equity Incentive Plan, as amended (the “EIP”), was originally approved by our stockholders on March 22,
2000. The EIP provides equity incentives to eligible employees and directors to attract, retain and motivate
individuals whose present and potential contributions are important to the success of EA. Since the EIP’s adoption,
138,865,000 shares of common stock have been reserved for issuance. For more information regarding the EIP,
please read the summary of its material terms, as proposed to be amended, included as Appendix C of this Proxy
Statement and the full text of the EIP, as proposed to be amended, filed with the SEC on June 10, 2016.
We are proposing amendments to the EIP that would:
•Increase the number of shares authorized under the EIP by 12,900,000 shares to a total of 151,765,000
shares.
We believe that alignment of the interests of our stockholders and our employees and directors is best
advanced through the issuance of equity incentives as a portion of their total compensation package. In
this way, we reinforce the link between our stockholders and our employees’ and directors’ focus on
personal responsibility, creativity and stockholder returns. Equity incentives such as RSUs also play an
important role in our recruitment and retention strategies, as the competition for creative and technical
talent and leadership in our industry and geographic area is intense.
While equity is a strategic tool for recruitment and retention, we also carefully manage RSU and PRSU
issuances and strive to keep the dilutive impact of the equity incentives we offer within a reasonable
range. The proposal to increase the number of shares authorized by 12,900,000 was determined based on
the results of an internal calculation of the cost of the EIP.
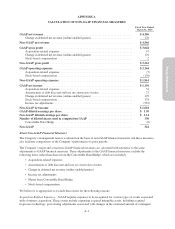
The following table includes the fiscal 2016 equity granted under the EIP:
FISCAL 2016 EQUITY GRANTED UNDER THE EIP(1)
RSUs
PRSUs (at Maximum
Vesting) Total
3,035,201 ........................................................ 790,060(2) 3,825,261
(1) The table above does not reflect 5,503 stock options, which were granted and immediately exercised by directors, who elected to receive
shares-in-lieu of their cash compensation.
(2) For PRSUs, reflects the maximum vesting of 200% of target shares that could be earned if the highest level of performance is attained. At
100% target vesting, the shares reflected in the table would decrease by 395,030. See the discussion of “PRSUs” in the “Compensation
Discussion and Analysis” above.
Together, the above referenced grants of RSUs and PRSUs represented awards covering approximately 1.23% of
our fiscal 2016 weighted average shares of common stock outstanding of 310,024,838 (assuming maximum
vesting of PRSUs) or 1.11% (assuming target vesting of PRSUs). Further, taking into consideration stock
options, RSUs and PRSUs that were cancelled, forfeited or expired during fiscal 2016, these grants represent
awards covering approximately 0.89% of our fiscal 2016 weighted average shares of common stock outstanding
(assuming maximum vesting of PRSUs) or 0.76% (assuming target vesting of PRSUs).
As of May 27, 2016, the Company had the following equity awards outstanding under all of the Company’s
equity plans (excluding the ESPP):
OUTSTANDING EQUITY AWARDS
Outstanding Stock Options
Weight Average
Exercise Price of
Outstanding Stock
Options
Weighted Average
Remaining Contractual
Life of Stock Options
Granted but Unvested
Shares of Restricted
Stock, RSUs and
PRSUs
3,164,192 ................................. $35.23 5.39 5,048,610(1)
52