Electronic Arts 2016 Annual Report Download - page 125
Download and view the complete annual report
Please find page 125 of the 2016 Electronic Arts annual report below. You can navigate through the pages in the report by either clicking on the pages listed below, or by using the keyword search tool below to find specific information within the annual report.-
 1
1 -
2
-
3
-
4
-
5
-
6
-
7
-
8
-
9
-
10
-
11
-
12
-
13
-
14
-
15
-
16
-
17
-
18
-
19
-
20
-
21
-
22
-
23
-
24
-
25
-
26
-
27
-
28
-
29
-
30
-
31
-
32
-
33
-
34
-
35
-
36
-
37
-
38
-
39
-
40
-
41
-
42
-
43
-
44
-
45
-
46
-
47
-
48
-
49
-
50
-
51
-
52
-
53
-
54
-
55
-
56
-
57
-
58
-
59
-
60
-
61
-
62
-
63
-
64
-
65
-
66
-
67
-
68
-
69
-
70
-
71
-
72
-
73
-
74
-
75
-
76
-
77
-
78
-
79
-
80
-
81
-
82
-
83
-
84
-
85
-
86
-
87
-
88
-
89
-
90
-
91
-
92
-
93
-
94
-
95
-
96
-
97
-
98
-
99
-
100
-
101
-
102
-
103
-
104
-
105
-
106
-
107
-
108
-
109
-
110
-
111
-
112
-
113
-
114
-
 115
115 -
 116
116 -
 117
117 -
 118
118 -
 119
119 -
 120
120 -
 121
121 -
 122
122 -
 123
123 -
 124
124 -
 125
125 -
 126
126 -
 127
127 -
 128
128 -
 129
129 -
 130
130 -
 131
131 -
 132
132 -
 133
133 -
 134
134 -
 135
135 -
136
-
137
-
138
-
139
-
140
-
141
-
142
-
143
-
144
-
145
-
146
-
147
-
148
-
149
-
150
-
151
-
152
-
153
-
154
-
155
-
156
-
157
-
158
-
159
-
160
-
161
-
162
-
163
-
164
-
165
-
166
-
167
-
168
-
169
-
170
-
171
-
172
-
173
-
174
-
175
-
176
-
177
-
178
-
179
-
180
-
181
-
182
-
183
-
184
-
185
-
186
-
187
-
188
 |
 |

Annual Report
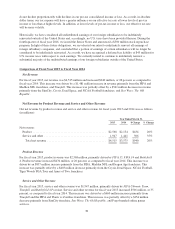
Cost of Revenue
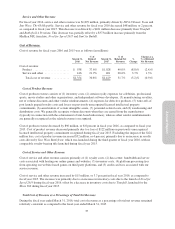
Cost of revenue for fiscal years 2015 and 2014 was as follows (in millions):
March 31,
2015
%of
Related
Net Revenue
March 31,
2014
%of
Related
Net Revenue % Change
Change as a
% of Related
Net Revenue
Cost of revenue:
Product ....................... $1,028 40.0% $1,032 48.4% (0.4)% (8.4)%
Service and other ............... 401 20.6% 315 21.9% 27.3% (1.3)%
Total cost of revenue .......... $1,429 31.7% $1,347 37.7% 6.1% (6.0)%
Cost of Product Revenue
Cost of product revenue decreased by $4 million, or 0.4 percent in fiscal year 2015, as compared to fiscal year
2014. Cost of product revenue decreased primarily due to an increase of digital product offerings (which have a
lower average cost than our packaged goods and other product net revenue) during fiscal year 2015, as compared
to the fiscal year 2014, partially offset by a loss of $122 million on a previously unrecognized licensed
intellectual property commitment recognized during the three months ended June 30, 2014.
Cost of Service and Other Revenue
Cost of service and other revenue increased by $86 million, or 27.3 percent in fiscal year 2015, as compared to
fiscal year 2014. The increase was primarily due to an increase in royalty-related costs due to FIFA Ultimate
Team,Madden Ultimate Team, and Titanfall.
Total Cost of Revenue as a Percentage of Total Net Revenue
During the fiscal year ended March 31, 2015, total cost of revenue as a percentage of total net revenue decreased
by 6.0 percent as compared to the fiscal year ended March 31, 2014. Excluding the loss of $122 million on
previously unrecognized license intellectual property recognized during three months ended June 30, 2014, total
cost of revenue as a percentage of total net revenue decreased 8.8 percent as a result of an increase in our digital
products and services that generally have a lower cost than our packaged goods and other products.
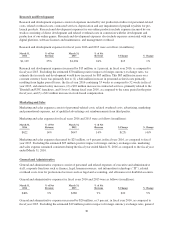
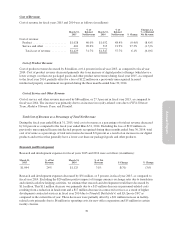
Research and Development
Research and development expenses for fiscal years 2015 and 2014 were as follows (in millions):
March 31,
2015
% of Net
Revenue
March 31,
2014
% of Net
Revenue $ Change % Change
$1,094 24% $1,125 31% $(31) (3)%
Research and development expenses decreased by $31 million, or 3 percent, in fiscal year 2015, as compared to
fiscal year 2014. Excluding the $20 million positive impact of foreign currency exchange rates due to translation
and related cash flow hedging activities, we estimate that research and development would have decreased by
$11 million. This $11 million decrease was primarily due to a $15 million decrease in personnel-related costs
resulting from a reduction in headcount and a $17 million decrease in contracted services as a result of higher
development contracted services in fiscal year 2014 due to Titanfall,Battlefield 4, and EA Sports UFC as
compared to the current fiscal year. These decreases were partially offset by a $21 million increase in facility-
related costs primarily due to $6 million in operating costs for new office expansions and $5 million in certain
facility closures.
39