Electronic Arts 2016 Annual Report Download - page 148
Download and view the complete annual report
Please find page 148 of the 2016 Electronic Arts annual report below. You can navigate through the pages in the report by either clicking on the pages listed below, or by using the keyword search tool below to find specific information within the annual report.-
 1
1 -
2
-
3
-
4
-
5
-
6
-
7
-
8
-
9
-
10
-
11
-
12
-
13
-
14
-
15
-
16
-
17
-
18
-
19
-
20
-
21
-
22
-
23
-
24
-
25
-
26
-
27
-
28
-
29
-
30
-
31
-
32
-
33
-
34
-
35
-
36
-
37
-
38
-
39
-
40
-
41
-
42
-
43
-
44
-
45
-
46
-
47
-
48
-
49
-
50
-
51
-
52
-
53
-
54
-
55
-
56
-
57
-
58
-
59
-
60
-
61
-
62
-
63
-
64
-
65
-
66
-
67
-
68
-
69
-
70
-
71
-
72
-
73
-
74
-
75
-
76
-
77
-
78
-
79
-
80
-
81
-
82
-
83
-
84
-
85
-
86
-
87
-
88
-
89
-
90
-
91
-
92
-
93
-
94
-
95
-
96
-
97
-
98
-
99
-
100
-
101
-
102
-
103
-
104
-
105
-
106
-
107
-
108
-
109
-
110
-
111
-
112
-
113
-
114
-
115
-
116
-
117
-
118
-
119
-
120
-
121
-
122
-
123
-
124
-
125
-
126
-
127
-
128
-
129
-
130
-
131
-
132
-
133
-
134
-
135
-
136
-
137
-
 138
138 -
 139
139 -
 140
140 -
 141
141 -
 142
142 -
 143
143 -
 144
144 -
 145
145 -
 146
146 -
 147
147 -
 148
148 -
 149
149 -
 150
150 -
 151
151 -
 152
152 -
 153
153 -
 154
154 -
 155
155 -
 156
156 -
 157
157 -
 158
158 -
159
-
160
-
161
-
162
-
163
-
164
-
165
-
166
-
167
-
168
-
169
-
170
-
171
-
172
-
173
-
174
-
175
-
176
-
177
-
178
-
179
-
180
-
181
-
182
-
183
-
184
-
185
-
186
-
187
-
188
 |
 |

Fair Value Measurements at Reporting
Date Using
As of
March 31,
2015
Quoted
Prices in
Active
Markets for
Identical
Financial
Instruments
Significant
Other
Observable
Inputs
Significant
Unobservable
Inputs
(Level 1) (Level 2) (Level 3) Balance Sheet Classification
Assets
Bank and time deposits ................ $ 175 $175 $ — $— Cash equivalents
Money market funds .................. 7 7 — — Cash equivalents
Available-for-sale securities:
Corporate bonds .................... 468 — 468 — Short-term investments and
cash equivalents
U.S. Treasury securities .............. 214 214 — — Short-term investments
U.S. agency securities ............... 180 — 180 — Short-term investments and
cash equivalents
Commercial paper .................. 140 — 140 — Short-term investments and
cash equivalents
Foreign currency derivatives ............ 18 — 18 — Other current assets
Deferred compensation plan assets(a) ...... 9 9 — — Other assets
Total assets at fair value ............. $1,211 $405 $806 $—
Liabilities
Foreign currency derivatives ............ 9 — 9 — Accrued and other current
liabilities
Deferred compensation plan liabilities(a) . . . 9 9 — — Other liabilities
Total liabilities at fair value ........... $ 18 $ 9 $ 9 $—
(a) The Deferred Compensation Plan assets consist of various mutual funds. See Note 15 for additional
information regarding our Deferred Compensation Plan.
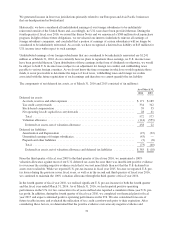
(3) FINANCIAL INSTRUMENTS
Cash and Cash Equivalents
As of March 31, 2016 and 2015, our cash and cash equivalents were $2,493 million and $2,068 million,
respectively. Cash equivalents were valued at their carrying amounts as they approximate fair value due to the
short maturities of these financial instruments.
Short-Term Investments
Short-term investments consisted of the following as of March 31, 2016 and 2015 (in millions):
As of March 31, 2016 As of March 31, 2015
Cost or
Amortized
Cost
Gross Unrealized Fair
Value
Cost or
Amortized
Cost
Gross Unrealized Fair
ValueGains Losses Gains Losses
Corporate bonds .................. $ 733 $ 1 $— $ 734 $467 $— $— $467
U.S. Treasury securities ............ 389 1 — 390 214 — — 214
U.S. agency securities ............. 167 — — 167 161 1 — 162
Commercial paper ................ 50 — — 50 110 — — 110
Short-term investments .......... $1,339 $ 2 $— $1,341 $952 $ 1 $— $953
62