Electronic Arts 2016 Annual Report Download - page 127
Download and view the complete annual report
Please find page 127 of the 2016 Electronic Arts annual report below. You can navigate through the pages in the report by either clicking on the pages listed below, or by using the keyword search tool below to find specific information within the annual report.-
 1
1 -
2
-
3
-
4
-
5
-
6
-
7
-
8
-
9
-
10
-
11
-
12
-
13
-
14
-
15
-
16
-
17
-
18
-
19
-
20
-
21
-
22
-
23
-
24
-
25
-
26
-
27
-
28
-
29
-
30
-
31
-
32
-
33
-
34
-
35
-
36
-
37
-
38
-
39
-
40
-
41
-
42
-
43
-
44
-
45
-
46
-
47
-
48
-
49
-
50
-
51
-
52
-
53
-
54
-
55
-
56
-
57
-
58
-
59
-
60
-
61
-
62
-
63
-
64
-
65
-
66
-
67
-
68
-
69
-
70
-
71
-
72
-
73
-
74
-
75
-
76
-
77
-
78
-
79
-
80
-
81
-
82
-
83
-
84
-
85
-
86
-
87
-
88
-
89
-
90
-
91
-
92
-
93
-
94
-
95
-
96
-
97
-
98
-
99
-
100
-
101
-
102
-
103
-
104
-
105
-
106
-
107
-
108
-
109
-
110
-
111
-
112
-
113
-
114
-
115
-
116
-
 117
117 -
 118
118 -
 119
119 -
 120
120 -
 121
121 -
 122
122 -
 123
123 -
 124
124 -
 125
125 -
 126
126 -
 127
127 -
 128
128 -
 129
129 -
 130
130 -
 131
131 -
 132
132 -
 133
133 -
 134
134 -
 135
135 -
 136
136 -
 137
137 -
138
-
139
-
140
-
141
-
142
-
143
-
144
-
145
-
146
-
147
-
148
-
149
-
150
-
151
-
152
-
153
-
154
-
155
-
156
-
157
-
158
-
159
-
160
-
161
-
162
-
163
-
164
-
165
-
166
-
167
-
168
-
169
-
170
-
171
-
172
-
173
-
174
-
175
-
176
-
177
-
178
-
179
-
180
-
181
-
182
-
183
-
184
-
185
-
186
-
187
-
188
 |
 |

Annual Report
Our effective tax rate for the fiscal year 2014 differs from the statutory rate of 35.0 percent as a result of the
utilization of U.S. deferred tax assets subject to a valuation allowance and tax benefits related to the expiration of
statutes of limitations and the resolution of examinations by taxing authorities.
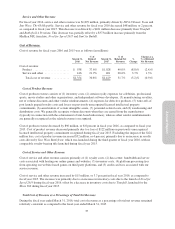
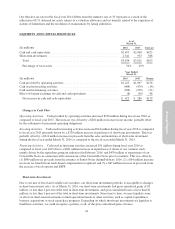
LIQUIDITY AND CAPITAL RESOURCES
As of
March 31,
(In millions) 2016 2015 Increase
Cash and cash equivalents ............................................. $2,493 $2,068 $425
Short-term investments ............................................... 1,341 953 388
Total ............................................................ $3,834 $3,021 $813
Percentage of total assets ............................................ 54% 49%
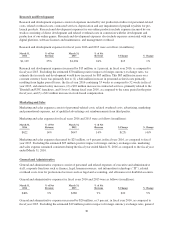
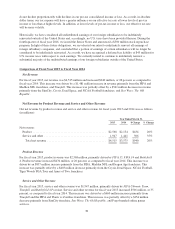
Year Ended
March 31,
(In millions) 2016 2015 Change
Cash provided by operating activities .................................... $1,223 $1,067 $156
Cash used in investing activities ........................................ (484) (470) (14)
Cash used in financing activities ........................................ (306) (255) (51)
Effect of foreign exchange on cash and cash equivalents ..................... (8) (56) 48
Net increase in cash and cash equivalents ............................... $ 425 $ 286 $139
Changes in Cash Flow
Operating Activities. Cash provided by operating activities increased $156 million during fiscal year 2016 as
compared to fiscal year 2015. The increase was driven by a $281 million increase in net income, partially offset
by the settlement of noncurrent operating obligations.
Investing Activities. Cash used in investing activities increased $14 million during fiscal year 2016 as compared
to fiscal year 2015 primarily driven by a $230 million increase in purchases of short-term investments. This was
partially offset by a $214 million increase in proceeds from the sales and maturities of short-term investment
during the fiscal year ended March 31, 2016 as compared to the fiscal year ended March 31, 2015.
Financing Activities. Cash used in financing activities increased $51 million during fiscal year 2016 as
compared to fiscal year 2015 due to a $681 million increase in repurchases of shares of our common stock
mainly driven by the repurchase program authorized in February 2016, and $470 million of repayments of our
Convertible Notes in connection with conversions of the Convertible Notes prior to maturity. This was offset by
(1) $989 million net proceeds from the issuance of Senior Notes during February 2016, (2) a $64 million increase
in excess tax benefit from stock-based compensation recognized, and (3) a $47 million increase in proceeds from
the exercise of stock options and ESPP.
Short-term Investments
Due to our mix of fixed and variable rate securities, our short-term investment portfolio is susceptible to changes
in short-term interest rates. As of March 31, 2016, our short-term investments had gross unrealized gains of $2
million, or less than 1 percent of the total in short-term investments, and gross unrealized losses of less than $1
million, or less than 1 percent of the total in short-term investments. From time to time, we may liquidate some
or all of our short-term investments to fund operational needs or other activities, such as capital expenditures,
business acquisitions or stock repurchase programs. Depending on which short-term investments we liquidate to
fund these activities, we could recognize a portion, or all, of the gross unrealized gains or losses.
41