Electronic Arts 2016 Annual Report Download - page 155
Download and view the complete annual report
Please find page 155 of the 2016 Electronic Arts annual report below. You can navigate through the pages in the report by either clicking on the pages listed below, or by using the keyword search tool below to find specific information within the annual report.-
 1
1 -
2
-
3
-
4
-
5
-
6
-
7
-
8
-
9
-
10
-
11
-
12
-
13
-
14
-
15
-
16
-
17
-
18
-
19
-
20
-
21
-
22
-
23
-
24
-
25
-
26
-
27
-
28
-
29
-
30
-
31
-
32
-
33
-
34
-
35
-
36
-
37
-
38
-
39
-
40
-
41
-
42
-
43
-
44
-
45
-
46
-
47
-
48
-
49
-
50
-
51
-
52
-
53
-
54
-
55
-
56
-
57
-
58
-
59
-
60
-
61
-
62
-
63
-
64
-
65
-
66
-
67
-
68
-
69
-
70
-
71
-
72
-
73
-
74
-
75
-
76
-
77
-
78
-
79
-
80
-
81
-
82
-
83
-
84
-
85
-
86
-
87
-
88
-
89
-
90
-
91
-
92
-
93
-
94
-
95
-
96
-
97
-
98
-
99
-
100
-
101
-
102
-
103
-
104
-
105
-
106
-
107
-
108
-
109
-
110
-
111
-
112
-
113
-
114
-
115
-
116
-
117
-
118
-
119
-
120
-
121
-
122
-
123
-
124
-
125
-
126
-
127
-
128
-
129
-
130
-
131
-
132
-
133
-
134
-
135
-
136
-
137
-
138
-
139
-
140
-
141
-
142
-
143
-
144
-
 145
145 -
 146
146 -
 147
147 -
 148
148 -
 149
149 -
 150
150 -
 151
151 -
 152
152 -
 153
153 -
 154
154 -
 155
155 -
 156
156 -
 157
157 -
 158
158 -
 159
159 -
 160
160 -
 161
161 -
 162
162 -
 163
163 -
 164
164 -
 165
165 -
166
-
167
-
168
-
169
-
170
-
171
-
172
-
173
-
174
-
175
-
176
-
177
-
178
-
179
-
180
-
181
-
182
-
183
-
184
-
185
-
186
-
187
-
188
 |
 |

Annual Report
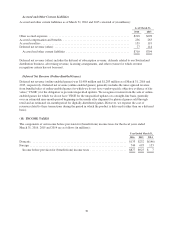
At any given time, depending on the timing of our payments to our co-publishing and/or distribution affiliates,
content licensors, and/or independent software developers, we classify any recognized unpaid royalty amounts
due to these parties as accrued liabilities. The current and long-term portions of accrued royalties, included in
accrued and other current liabilities and other liabilities, consisted of (in millions):
As of March 31,
2016 2015
Accrued royalties ............................................................ $159 $119
Other liabilities ............................................................. 118 131
Royalty-related liabilities ................................................... $277 $250
As of March 31, 2016, we were committed to pay approximately $1,460 million to content licensors, independent
software developers, and co-publishing and/or distribution affiliates, but performance remained with the
counterparty (i.e., delivery of the product or content or other factors) and such commitments were therefore not
recorded in our Consolidated Financial Statements. See Note 13 for further information on our developer and
licensor commitments.
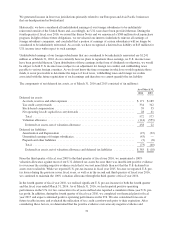
(10) BALANCE SHEET DETAILS
Inventories
Inventories as of March 31, 2016 and 2015 consisted of (in millions):
As of March 31,
2016 2015
Finished goods .............................................................. $32 $35
Raw materials and work in process .............................................. 1 1
Inventories ............................................................... $33 $36
Property and Equipment, Net
Property and equipment, net, as of March 31, 2016 and 2015 consisted of (in millions):
As of March 31,
2016 2015
Computer equipment and software .............................................. $ 684 $ 655
Buildings .................................................................. 313 315
Leasehold improvements ...................................................... 129 126
Equipment, furniture and fixtures, and other ....................................... 80 73
Land ...................................................................... 61 62
Construction in progress ...................................................... 15 7
1,282 1,238
Less: accumulated depreciation ................................................. (843) (779)
Property and equipment, net ................................................. $ 439 $ 459
Depreciation expense associated with property and equipment was $119 million, $126 million and $126 million
for the fiscal years ended March 31, 2016, 2015 and 2014, respectively.
69