Humana 1999 Annual Report Download - page 13
Download and view the complete annual report
Please find page 13 of the 1999 Humana annual report below. You can navigate through the pages in the report by either clicking on the pages listed below, or by using the keyword search tool below to find specific information within the annual report.-
 1
1 -
2
-
 3
3 -
 4
4 -
 5
5 -
 6
6 -
 7
7 -
 8
8 -
 9
9 -
 10
10 -
 11
11 -
 12
12 -
 13
13 -
 14
14 -
 15
15 -
 16
16 -
 17
17 -
 18
18 -
 19
19 -
 20
20 -
 21
21 -
 22
22 -
 23
23 -
24
-
25
-
26
-
27
-
28
-
29
-
30
 |
 |

Selected Financial Data
Management’s Discussion and Analysis of Financial Condition and Results of Operations
Consolidated Balance Sheets
Consolidated Statements of Operations
Consolidated Statements of Stockholders’ Equity
Consolidated Statements of Cash Flows
Notes to Consolidated Financial Statements
Report of Independent Accountants
Quarterly Financial Information (Unaudited)
Board of Directors
Senior Officers
Additional Information
23
24
35
36
37
38
39
51
52
53
54
55
FINANCIAL SECTION
23
HU M A N A IN C ./
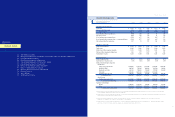
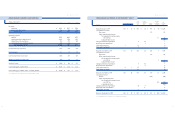
SELECTED FINANCIAL DATA
(Dollars in millions, except per share results)
For the years ended December 31, 1999 (a) 1998 (b) 1997 (c) 1996 (d) 1995 (c)
S U M M A R Y O F O PE RAT I O N S
Premiums $ 9,959 $ 9,597 $ 7,880 $ 6,677 $ 4,605
Interest and other income 154 184 156 111 97
Total revenues 10,113 9,781 8,036 6,788 4,702
(Loss) income before income taxes (404) 203 270 18 288
Net (loss) income (382) 129 173 12 190
(Loss) earnings per common share (2.28) 0.77 1.06 0.07 1.17
(Loss) earnings per common share — assuming dilution (2.28) 0.77 1.05 0.07 1.16
Net cash provided by operations 217 55 279 341 150
F I N A N CI A L P O S I T I O N
Cash and investments $ 2,738 $ 2,812 $ 2,798 $ 1,880 $ 1,696
Total assets 4,900 5,496 5,600 3,306 3,056
Medical and other expenses payable 1,756 1,908 2,075 1,099 866
Debt and other long-term obligations 830 977 1,057 361 399
Stockholders’ equity 1,268 1,688 1,501 1,292 1,287
O P E R AT I N G D ATA
Medical expense ratio 85.7% 83.8% 82.8% 84.3% 81.7%
Administrative expense ratio 15.0% 15.2% 15.5% 15.5% 13.9%
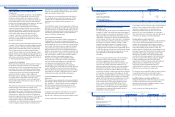
Medical membership by segment:
Health Plan:
Large group commercial 1,420,500 1,559,700 1,661,900 1,435,000 1,502,500
Medicare HMO 488,500 502,000 480,800 364,500 310,400
Medicaid and other 661,100 700,400 704,000 152,900 164,000
TRICARE 1,058,000 1,085,700 1,112,200 1,103,000
Administrative services 648,000 646,200 651,200 471,000 495,100
Total Health Plan 4,276,100 4,494,000 4,610,100 3,526,400 2,472,000
Small Group:
Small group commercial 1,663,100 1,701,800 1,596,700 1,324,600 1,332,400
Total medical membership 5,939,200 6,195,800 6,206,800 4,851,000 3,804,400
Specialty membership:
Dental 1,628,200 1,375,500 936,400 844,800 797,000
Other 1,333,100 1,257,800 1,504,200 1,039,400 1,063,000
Total specialty membership 2,961,300 2,633,300 2,440,600 1,884,200 1,860,000
(a) Includes expenses of $585 million pretax ($499 million a ft er tax, or $2 .9 7 per diluted share) primarily related to good wi ll writ e-down, losses on non-core asset sales, professional liability
(a) re s e rve strengthening, premium deficiency and medical re s e r ve stre n g t h e n i n g .
(b) Includes expenses of $132 million pr etax ($84 mil li on after t ax, or $0.50 per diluted share) primarily re lated to the costs of c ertai n market exits and product discontinuanc es, asset write-offs,
(a) p remium deficiency and a one-time non-officer employee incen tive.
(c) Includes the operations of Health Direct, Inc., Physician Corporation of America, ChoiceCar e Corporation and EMPHESYS Financial Group, Inc. since th eir dates of acquisition,
(a) F e b ru a r y 28, 19 97, September 8, 1997, October 17, 1997 and October 1 1, 1995 , re s p e c t i v e l y.
(d) Includes expenses of $215 million pretax ($140 million after tax, or $0.85 per diluted share) primarily related t o the closing of the Wa sh ington, D.C. and certain other market s, seve rance
(a) and facility costs for workforce reduct ions, product disco nt inuance costs, premium deficiency, litigation and other costs.