Humana 1999 Annual Report Download - page 17
Download and view the complete annual report
Please find page 17 of the 1999 Humana annual report below. You can navigate through the pages in the report by either clicking on the pages listed below, or by using the keyword search tool below to find specific information within the annual report.-
 1
1 -
2
-
3
-
4
-
5
-
6
-
 7
7 -
 8
8 -
 9
9 -
 10
10 -
 11
11 -
 12
12 -
 13
13 -
 14
14 -
 15
15 -
 16
16 -
 17
17 -
 18
18 -
 19
19 -
 20
20 -
 21
21 -
 22
22 -
 23
23 -
 24
24 -
 25
25 -
 26
26 -
 27
27 -
28
-
29
-
30
 |
 |

assets approximated 7.7 percent and 7.5 percent for the
years ended December 31, 1998 and 1997, respectively. Tax
equivalent yield is the rate earned on invested assets,
excluding unrealized gains and losses, adjusted for the
benefit of nontaxable investment income. The weighted
average investment life increased to 2.7 years at December
31, 1998, from 2.6 years at December 31, 1997. Interest
expense increased $27 million during 1998 from funding
the PCAand ChoiceCare acquisitions with
additional borrowings.
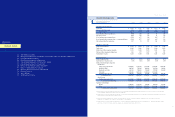
B U S IN E S S S E G M E NT I N F OR MAT I O N FO R T H E Y E A RS
EN D E D D EC EM BER 31 , 19 98 AND 1997
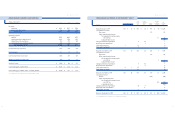
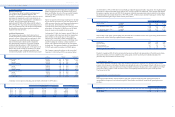
The following table presents segment medical membership
and activity for 1998 and 1997:
31
Administration in Puerto Rico in the second quarter of
1999. TRICARE premium revenues increased 8.3 percent to
$866 million in 1999, from $800 million in 1998, resulting
from an annual contract rate increase and additional
premiums recorded related to TRICARE’s risk-sharing
arrangement with the government.
The Health Plan segment’s adjusted medical expense ratio
for 1999 was 86.4 percent, increasing from 84.4 percent in
1998. The increase was the result of large group commercial
and Medicare HMO medical costs exceeding premium
increases. These higher medical cost trends were
attributable to the inability of certain risk-sharing providers
to effectively manage medical costs within their contractual
arrangements, higher pharmacy utilization and generally
higher medical cost trends across the industry. The
Company expects to realize improvements in its medical
cost trends in 2000 resulting from implementation of the
three-tier pharmacy benefit designs, improvements in risk-
sharing arrangements, the exit of unprofitable Medicare
HMO counties and the sale of its Medicare supplement and
North Florida Medicaid businesses.
The adjusted administrative expense ratio improved 50
basis points from 1998 to 12.1 percent, the result of the
continued rationalization of staffing levels commensurate
with membership levels.
Small Group
The Small Group segment’s adjusted loss before income
taxes was $3 million for 1999 compared to adjusted income
before income taxes of $31 million for 1998. The decline in
profitability is attributable to higher medical costs which
were not adequately anticipated by the Company when it
established premium rates for 1999. To mitigate the effect
of higher medical costs, the Small Group segment’s
improvement initiatives include significant premium rate
increases, improving claim payment processes, provider
re-contracting, rationalizing markets and products and
implementing three-tier pharmacy benefit designs.
The Small Group segment’s premium revenues increased
9.4 percent for 1999 to $3.1 billion from $2.9 billion for 1998.
This premium increase was the result of increased premium
yields, offset by a reduction of 38,700 members from the
sale of the individual line of business in Florida.
The Small Group segment’s adjusted medical expense ratio
for 1999 was 81.2 percent, increasing from 79.7 percent for
1998. The medical expense ratio increase was the result of
medical costs exceeding premium yields. These higher
medical cost trends were the result of the rapid growth of
the Company’s more costly open access products, higher
pharmacy utilization and the greater than expected impact
of the Health Insurance Portability and Accountability Act
or HIPAAand its guarantee issue requirements.
The adjusted administrative expense ratio improved during
1999 to 20.1 percent from 20.3 percent for 1998.
Y E A R S E N DE D D EC EMB ER 31, 199 8 AND 19 97
Adjusted income before income taxes totaled $335 million
for the year ended December 31, 1998, compared to $270
million for the year ended December 31, 1997. Adjusted net
income was $213 million or $1.27 per diluted share in 1998,
compared to $173 million or $1.05 per diluted share in
1997. The earnings increase was a result of the full year
contribution from the 1997 PCAand ChoiceCare
acquisitions, higher commercial premium yields, provider
risk-sharing initiatives, improved claims payment accuracy
across various product lines, and increased interest and
other income. These favorable items were partially offset by
higher interest expense and increased pharmacy costs.
The Company’s 1998 premium revenues increased 21.8
percent to $9.6 billion, from $7.9 billion for the year ended
December 31, 1997. This increase was attributable to the
current year effect of 1997 acquisitions, commercial and
Medicare HMO same-plan membership growth and
increased premium rates for the Company’s commercial
products. PCAand ChoiceCare premium revenues
contributed approximately $1.6 billion, a $1.1 billion
increase over 1997. Same-plan membership growth
contributed $120 million and commercial premium rate
increases added approximately $186 million, as same-plan
commercial premium yields increased 4.8 percent. Changes
in Medicare HMO premium yield had little effect on
premium revenues as same-plan yields declined 0.4 percent
in 1998. The Medicare 2 percent statutory rate increase for
1998 was offset by membership growth in geographic areas
with lower reimbursement rates.
During 1998, the Company’s adjusted medical expense ratio
increased to 83.0 percent from 82.8 percent for the year
ended December 31, 1997. The year to year increase was the
result of the higher medical expense ratio of acquired plans
being included for a full year during 1998. The same-plan
medical expense ratio improved 20 basis points to 82.2
percent from 82.4 percent in 1997, the result of the afore-
mentioned premium rate increases, provider risk-sharing
initiatives and improved claim payment accuracy. These
improvements were partially offset by increased year-over-
year pharmacy costs of 16 percent and 9 percent for the
Company’s commercial and Medicare HMO products,
respectively.
The Company’s adjusted administrative expense ratio was
14.9 percent and 15.5 percent for the years ended December
31, 1998 and 1997, respectively. This improvement was the
result of efforts to streamline the organization, as well as
realized cost savings from the Company’s 1997 acquisitions.
Interest income totaled $150 million for the year ended
December 31, 1998, compared to $131 million for the year
ended December 31, 1997. The increase was attributable to
the full year impact of including PCA’s and ChoiceCare’s
investment portfolios, as well as increased realized
investment gains. The tax equivalent yield on invested
30
HU M A N A IN C .
MANAGEMENT’S DI SCUSSION AN D A NA LYSIS OF FINANCIAL CONDITION AND RESULTS O F O PERATIONS
1998 1997
(In thousands) Health Plan Small Group Total Health Plan Small Group Total
Beginning medical membership 4,610 1,597 6,207 3,526 1,325 4,851
Sales 610 571 1,181 499 458 957
Cancellations (700) (466) (1,166) (465) (392) (857)
Acquisitions 1,188 206 1,394
Dispositions (147) (147)
TRICARE change (26) (26) 9 9
Ending medical membership 4,494 1,702 6,196 4,610 1,597 6,207
Ending specialty membership 444 2,189 2,633 507 1,934 2,441
The following table presents certain financial data for the
Company’s two segments for the years ended December 31,
1998 and 1997:
(In millions) 1998 (a) 1997
Premium revenues:
Health Plan $ 6,734 $ 5,487
Small Group 2,863 2,393
$ 9,597 $ 7,880
Adjusted income before income taxes:
Health Plan $ 304 $ 244
Small Group 31 26
$ 335 $ 270
Adjusted medical expense ratios:
Health Plan 84.4% 84.3%
Small Group 79.7% 79.4%
83.0% 82.8%
Adjusted administrative expense ratios:
Health Plan 12.6% 13.1%
Small Group 20.3% 21.0%
14.9% 15.5%
(a) Excludes the previously discussed medical exp enses of $73 million ($60 million Health
(a) Plan and $13 million Small Group), administra tive exp enses of $25 million ($13 million
(a) Health Plan and $12 million Small Group) and asset write-downs and other expenses of
(a) $34 million ($23 million Health Pl an and $ 11 million Sm all G ro u p ) .
Health Plan
Adjusted income before income taxes totaled $304 million
in 1998 compared to $244 million in 1997. The earnings
increase is attributable to the full year contribution from
1997 acquisitions of PCAand ChoiceCare, improved claim
payment accuracy and administrative expense reductions.
The Health Plan segment’s premium revenues increased
22.7 percent to $6.7 billion in 1998. This increase was
attributable to the current year effect of the 1997
acquisitions, large group commercial and Medicare HMO
same-plan membership growth and higher large group
commercial premium yields.
The Health Plan segment’s adjusted medical expense ratio
increased 10 basis points to 84.4 percent. The increase was
the result of the higher medical expense ratio of acquired
plans being included for a full year during 1998 and higher
pharmacy costs.
The adjusted administrative expense ratio improved during
1998 to 12.6 percent from 13.1 percent in 1997 in the Health
Plan segment. This improvement reflects realized cost
savings from integrating the PCAand ChoiceCare
acquisitions into Humana’s operating model.
Small Group
Adjusted income before income taxes was $31 million in
1998 compared to $26 million in 1997. The earnings increase
is primarily attributable to improved claims payment
accuracy, increased interest and other income and
administrative expense reductions. These favorable items
were partially offset by higher interest expense and
increased pharmacy costs.
The Small Group segment’s premium revenues increased
19.6 percent to $2.9 billion in 1998. This increase was
primarily attributable to the current year effect of the 1997
acquisitions and small group commercial and specialty
same-plan membership growth.
The Small Group segment’s adjusted medical expense ratio
increased 30 basis points to 79.7 percent. The year to year
increase was the result of the higher medical expense ratio
of acquired plans being included for a full year during 1998
and higher pharmacy costs.
The adjusted administrative expense ratio improved during
1998 to 20.3 percent from 21.0 percent in 1997 in the Small
Group segment. This improvement reflects the continued
rationalization of staffing levels commensurate with
membership levels.
L I Q U I D I T Y
Operating cash flows improved to $217 million in 1999
from $55 million in 1998, due to increased premium receipts
and reduced payments for accrued expenses, taxes,
severance and professional liabilities. Partially offsetting
these improvements were higher claim payments related to
the Company’s run-off workers’ compensation business.