Humana 1999 Annual Report Download - page 18
Download and view the complete annual report
Please find page 18 of the 1999 Humana annual report below. You can navigate through the pages in the report by either clicking on the pages listed below, or by using the keyword search tool below to find specific information within the annual report.-
 1
1 -
2
-
3
-
4
-
5
-
6
-
7
-
 8
8 -
 9
9 -
 10
10 -
 11
11 -
 12
12 -
 13
13 -
 14
14 -
 15
15 -
 16
16 -
 17
17 -
 18
18 -
 19
19 -
 20
20 -
 21
21 -
 22
22 -
 23
23 -
 24
24 -
 25
25 -
 26
26 -
 27
27 -
 28
28 -
29
-
30
 |
 |

Changes in equity valuations (based upon the Standard &
Poor’s 500 stock index) over the past ten years which were in
excess of 30 percent occurred four times, between 20 percent
and 30 percent occurred three times and between 10 percent
and 20 percent also occurred three times.
C A P I TAL R E S O U R C ES
The Company’s ongoing capital expenditures relate
primarily to information systems and administrative
facilities necessary for activities such as claims processing,
billing and collections, medical utilization review and
customer service. Total capital expenditures, excluding
acquisitions, were $89 million, $104 million and $73 million
for the years ended December 31, 1999, 1998 and 1997,
respectively. Capital expenditures during 1998 included the
$32 million purchase and renovation of a regional customer
service center in Jacksonville, Florida.
Excluding acquisitions, planned capital spending in 2000
will approximate $130 million to $140 million for the
funding of the Company’s technology initiatives and
expansion and improvement of its administrative facilities.
E F F E C TS O F I N F LATI ON A ND CH A NG IN G P R I C E S
The Company’s operations are regulated by various state
and federal government agencies. Actuarially determined
premium rate increases for commercial products are
generally approved by the respective state insurance
commissioners, while increases in premiums for Medicaid
and Medicare HMO products are established by various
state governments and the Health Care Financing
Administration. Premium rates under the TRICARE
contract with the United States Department of Defense may
be adjusted on a year by year basis to reflect inflation,
changes in the workload volumes of military medical
facilities and contract modifications.
The Company’s 2000 average rate of statutory increase
under the Medicare HMO contracts is approximately two
percent. Over the last five years, annual increases have
ranged from as low as the January 1999 increase of two
percent to as high as nine percent in January 1996, with an
average of approximately five percent. The Company’s
Medicare HMO contracts with the federal government are
renewed for a one-year term each December 31 unless
terminated 90 days prior thereto.
Legislative proposals are being considered which may
revise the Medicare program’s current support of the use of
managed health care for Medicare beneficiaries and the
future reimbursement rates thereunder. Management is
unable to predict the outcome of these proposals or the
impact they may have on the Company’s financial position,
results of operations or cash flows. The Company’s
Medicaid contracts are generally annual contracts with
various states except for the two-year contract with the
Health Insurance Administration in Puerto Rico.
Additionally, the Company’s TRICARE contract is a one-
year contract renewable on July 1, 2000, for one additional
year. The loss of these contracts or significant changes in
these programs as a result of legislative action, including
reductions in payments or increases in benefits without
corresponding increases in payments, would have a
material adverse effect on the revenues, profitability and
business prospects of the Company.
In addition, the Company continually contracts and seeks
to renew contracts with providers at rates designed to
ensure adequate profitability. To the extent the Company is
unable to obtain such rates, its financial position, results of
operations and cash flows could be adversely impacted.
TH E C O M PAN Y’ S YE AR 20 0 0 D I S C L OS U R E S TAT E M E N T
The Company commenced its assessment of Year 2000
exposures in early 1996. In December 1998, the Company
was 100 percent complete with the remediation of its core
business systems and by December 1999 had remediated
100 percent of its business application systems. As of
December 31, 1999, the Company had completed all Year
2000 initiatives.
To date, the Company has experienced no outages or
problems related to the Year 2000 date rollover. All business
systems are functioning normally and the Company has not
experienced any disruptions in service with third party
organizations with which it interacts related to the
century change.
The Company’s application systems are largely developed
and maintained in-house by a staff of 400 application
programmers who are versed in the utilization of state-of-
the-art technology. All application systems are fully
integrated and automatically pass data through various
system processes. The Company’s primary data center and
the majority of its programming and support staff are
located at the Company’s corporate offices in Louisville,
Kentucky. In order to create the necessary internal focus
surrounding the Year 2000 issue, the Company established
a centralized Year 2000 Program Management Office
(“PMO”) which is charged with overall coordination of
enterprise wide Year 2000 initiatives and regular progress
reporting to the Company’s senior management.
The Year 2000 project is currently estimated to have a
minimum total cost of approximately $30 million of which
approximately $10 million was spent during 1999. Year 2000
expenses represented less than ten percent of the
Information Systems budget during 1999. Year 2000 costs
are expensed as incurred and funded with cash flows from
operations. The Company does not expect to incur
significant Year 2000 project costs in the year 2000.
The extent and magnitude of the Year 2000 project, as it will
affect the Company for some period after January 1, 2000, is
difficult to predict or quantify. In order to mitigate these
risks, the Company developed business continuity and
contingency plans which were finalized in the second
quarter of 1999. These plans would be enacted if Year 2000
problems were to occur within the Company, or if third
party constituents have failures due to the millennium
change. Contingency plans were developed for six major
functional areas encompassing 22 operational subdivisions
33
Cash provided by investing activities was $18 million
in 1999, compared to $28 million in 1998. These amounts
reflect the net effect of investment and capital
expenditure transactions.
Cash used in financing activities totaled $170 million in
1999 compared to cash provided by financing activities of
$51 million in 1998. This decrease primarily resulted from
1999 debt repayments and changes in book overdrafts.
The Company’s subsidiaries operate in states that require
minimum levels of equity and regulate the payment of
dividends to the parent company. As a result, the
Company’s ability to use operating subsidiaries’ cash flows
is restricted to the extent of the subsidiaries’ ability to
obtain regulatory approval to pay dividends.
The National Association of Insurance Commissioners has
recommended that states adopt a risk-based capital (“RBC”)
formula for companies established as HMO entities, similar
to the current requirement for insurance companies. The
RBC provisions may require new minimum capital and
surplus levels for some of the Company’s HMO sub-
sidiaries. Many states have not yet determined when they
will adopt the RBC formula or if they will allow a phase-in
to the required levels of capital and surplus.
The Company currently maintains approximately $768
million of capital and surplus in its health insurance and
HMO entities, compared to the minimum statutory
required capital and surplus levels of approximately $569
million. If the states in which the Company conducts
business adopt the proposed RBC formula, without a
phase-in provision, the Company estimates it would be
required to fund additional capital into its various
subsidiaries of approximately $45 million. After this capital
infusion, the Company would have $138 million of capital
and surplus above the required RBC level.
The Company maintains a revolving credit agreement
(“Credit Agreement”) which provides a line of credit of up
to $1.0 billion and expires in August 2002. Principal
amounts outstanding under the Credit Agreement bear
interest at either a fixed rate or a floating rate, ranging from
LIBOR plus 35 basis points to LIBOR plus 80 basis points,
depending on the Company’s credit ratings. The Credit
Agreement, which was amended in 1999 to reduce the line
of credit by $500 million from $1.5 billion and modify
certain covenants, contains customary covenants and events
of default including, but not limited to, financial tests for
interest coverage and leverage. The Company is in
compliance with all covenants. The Company also
maintains and issues short-term debt securities under a
commercial paper program.
Management believes that funds from planned divestitures,
future operating cash flows and funds available under the
existing Credit Agreement and commercial paper program
are sufficient to meet future liquidity needs. Management
also believes the aforementioned sources of funds are
adequate to allow the Company to pursue selected
acquisition and expansion opportunities, as well as to fund
capital requirements.
RI S K - S EN S I T I V E F IN A NC I A L IN S T R U M E N TS A ND PO SI T IO NS
The Company’s risk of fluctuation in earnings due to
changes in interest income from its fixed income portfolio is
partially mitigated by the Company’s debt position, as well
as the short duration of the fixed income portfolio.
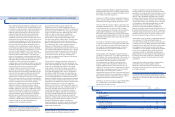
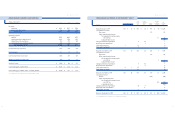
The Company has evaluated the interest income and debt
expense impact resulting from a hypothetical change in
interest rates of 100, 200 and 300 basis points over the next
twelve-month period, as reflected in the following table. In
the past ten years, annual changes in commercial paper
rates have never exceeded 300 basis points, changed
between 200 and 300 basis points twice and changed
between 100 and 200 basis points once. The modeling
technique used to calculate the pro forma net change
considered the cash flows related to fixed income
investments and debt, which are subject to interest rate
changes during a prospective twelve-month period.
32
HU M A N A IN C .
MANAGEMENT’S DI SCUSSION AN D A NA LYSIS OF FINANCIAL CONDITION A ND RESULTS OF OPERATI ONS
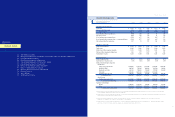
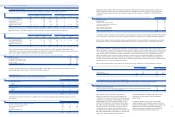
Increase (decrease) in earnings given an interest rate Increase (decrease) in earnings given an interest rate
(In millions) decrease of X basis points increase of X basis points
(300) (200) (100) 100 200 300
1999
Fixed income portfolio $ (10.1) $ (6.7) $ (3.4) $ 3.4 $ 6.8 $ 10.2
Debt 9.1 6.1 3.0 (3.0) (6.1) (9.1)
Total $ (1.0) $ (0.6) $ (0.4) $ 0.4 $ 0.7 $ 1.1
1998
Fixed income portfolio $ (11.9) $ (7.9) $ (4.0) $ 4.0 $ 8.0 $ 12.0
Debt 5.7 3.8 1.9 (1.9) (3.8) (5.7)
Total $ (6.2) $ (4.1) $ (2.1) $ 2.1 $ 4.2 $ 6.3
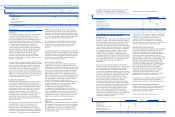
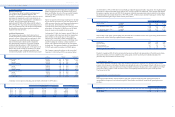
The following table presents the hypothetical change in fair market values of common equity securities held by the Company
at December 31, 1999 and 1998, which are sensitive to changes in stock market values. These common equity securities are held
for purposes other than trading.
Decrease in valuation of securities Increase in valuation of securities
given an X% decrease in Fair Value at given an X% increase in
(In millions) each equity security’s value December 31, each equity security’s value
(30%) (20%) (10%) 10% 20% 30%
1999
Common equity securities $ (5.6) $ (3.7) $ (1.9) $ 18.6 $ 1.9 $ 3.7 $ 5.6
1998
Common equity securities $ (18.6) $ (12.4) $ (6.2) $ 62.1 $ 6.2 $ 12.4 $ 18.6