Humana 1999 Annual Report Download - page 16
Download and view the complete annual report
Please find page 16 of the 1999 Humana annual report below. You can navigate through the pages in the report by either clicking on the pages listed below, or by using the keyword search tool below to find specific information within the annual report.-
 1
1 -
2
-
3
-
4
-
5
-
 6
6 -
 7
7 -
 8
8 -
 9
9 -
 10
10 -
 11
11 -
 12
12 -
 13
13 -
 14
14 -
 15
15 -
 16
16 -
 17
17 -
 18
18 -
 19
19 -
 20
20 -
 21
21 -
 22
22 -
 23
23 -
 24
24 -
 25
25 -
 26
26 -
27
-
28
-
29
-
30
 |
 |

file closings, the Company reduced these liabilities by $36
million ($23 million after tax, or $0.14 per diluted share)
and $5 million ($3 million after tax, or $0.02 per diluted
share) in 1999 and 1998, respectively.
The adjusted administrative expense ratio improved
during 1999 to 14.6 percent from 14.9 percent in 1998. The
year-over-year improvement in the administrative expense
ratio reflects continued rationalization of staffing levels
commensurate with membership levels. The administrative
expense ratio is expected to increase slightly in 2000 from
increased spending on information technology.
Interest income totaled $132 million for 1999 and $150
million for 1998. This decrease resulted from a decrease in
realized investment gains, lower average invested balances
and lower investment yields. The tax equivalent yield on
invested assets approximated 7.1 percent for 1999 and 7.7
percent for 1998. Tax equivalent yield is the rate earned on
invested assets, excluding unrealized gains and losses,
adjusted for the benefit of nontaxable investment income.
The weighted average investment life was 2.7 years at both
December 31, 1999 and 1998. Other income declined $12
million during 1999, due to the reduction of income from
ancillary businesses the Company sold in 1998 and a lower
contribution from the Company’s ASO business, partially
offset by a $12 million gain from the sale of a tangible asset
in 1999. Interest expense declined $14 million during 1999
as a result of lower average outstanding borrowings.
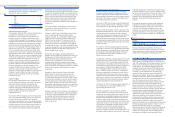
BUS I N E S S S E G M E N T I N F O RM AT I ON FO R T H E Y EA RS
EN D E D D EC EM BER 31 , 19 99 AND 1998
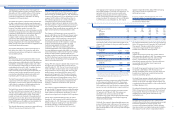
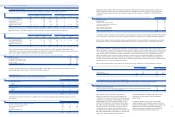
The following table presents segment medical membership
and activity for 1999 and 1998:
Y E A RS E N D E D DE C EMB ER 31, 199 9 AN D 19 98
Adjusted income before income taxes totaled $181 million
for the year ended December 31, 1999, compared to $335
million for the year ended December 31, 1998. Adjusted net
income was $117 million or $0.69 per diluted share in 1999,
compared to $213 million or $1.27 per diluted share in 1998.
The earnings decline was attributable to higher medical cost
trends which were not adequately anticipated by the
Company when it established premium rates for 1999.
These higher medical cost trends primarily resulted from
the introduction and rapid growth of an open access
product, ineffective risk-sharing arrangements, significant
increases in pharmacy costs and the unfavorable
negotiations of the Florida Columbia/HCAprovider
contract. During 1999, the Company implemented
initiatives to mitigate the effect of these issues. The
initiatives include pricing products commensurate with the
higher medical costs, rationalizing markets and products,
rehabilitating the large group commercial business,
re-contracting with providers and cost management
improvements focused mainly on medical and claims cost
management disciplines. These initiatives began to improve
operating results in the second half of 1999 but in large
part will be realized in January 2000 when the majority of
the Company’s large group commercial customers renew
and when the Company’s Medicare product offerings
were adjusted.
The Company’s premium revenues increased 3.8 percent to
a record $10.0 billion for 1999, compared to $9.6 billion for
1998. Higher premium revenues resulted from increased
premium yields of 7.4 percent and 3.4 percent for the
Company’s commercial and Medicare HMO products,
respectively. This increase was partially offset by a decline
in commercial membership of 177,900, due to selling the
Florida individual business line and the result of substantial
premium increases delivered to large group and small
group commercial customers. Membership levels are
expected to decline in 2000 due to the sale of certain non-
core businesses and substantial premium rate increases.
The Company expects commercial and Medicare HMO
premium yields to approximate 10 to 12 percent and 6 to 7
percent, respectively, in 2000, the result of commercial
premium rate increases and newly introduced Medicare
member premiums.
The Company’s adjusted medical expense ratio for 1999
was 84.8 percent, compared to 83.0 percent for 1998. The
increase was the result of medical cost increases in the
Company’s commercial products exceeding premium
rate increases. Offsetting the impact of the increasing
commercial medical costs was the continued favorable
claim liability development in the Company’s run-off
workers’ compensation business acquired in connection
with its acquisition of PCA. After evaluating the workers’
compensation claim liabilities against claim payments and
29
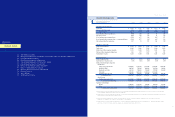
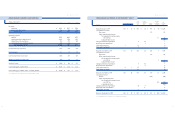
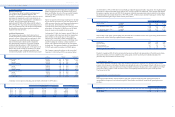
C O M PARIS O N O F R E S U LT S O F O P E RAT I O N S
In order to enhance comparability as well as to provide a
baseline against which historical and prospective periods
can be measured, the following discussion comparing
results for the years ended December 31, 1999, 1998 and
1997, excludes the previously described expenses, but does
include the beneficial effect related to premium deficiency
on operating results for the periods shown. There were no
adjustments to results for 1997. The following table
reconciles the results reported in the Consolidated
Statements of Operations (“Reported Results”) to the results
contained in the following discussion (“Adjusted Results”)
for 1999 and 1998:
28
HU M A N A IN C .
MANAGEMENT’S DI SCUSSION AN D A NA LYSIS OF FINANCIAL CONDITION AND RESULTS O F O PERATIONS
Reported Results Excluded Expenses Adjusted Results
(In millions, except per share results) 1999 1998 1999 (a) 1998 (b) 1999 1998
Consolidated Statements of Operations caption items that are adjusted:
Operating expenses:
Medical $ 8,532 $ 8,041 $ (90) $ (73) $ 8,442 $ 7,968
Selling, general and administrative 1,368 1,328 (35) (25) 1,333 1,303
Depreciation and amortization 124 128 124 128
Asset write-downs and other expenses 460 34 (460) (34) — —
Total operating expenses 10,484 9,531 (585) (132) 9,899 9,399
(Loss) income from operations (371) 250 585 132 214 382
(Loss) income before income taxes (404) 203 585 132 181 335
Net (loss) income $ (382) $ 129 $ 499 $ 84 $ 117 $ 213
(Loss) earnings per common share $ (2.28) $ 0.77 $ 2.97 $ 0.50 $ 0.69 $ 1.28
Diluted (loss) earnings per common share $ (2.28) $ 0.77 $ 2.97 $ 0.50 $ 0.69 $ 1.27
Reported Ratios Ratio Effect of Excluded Expenses Adjusted Ratios
1999 1998 1999 (a) 1998 (b) 1999 1998
Medical expense ratios:
Health Plan 87.4% 85.3% (1.0)% (0.9)% 86.4% 84.4%
Small Group 81.9% 80.2% (0.7)% (0.5)% 81.2% 79.7%
Total 85.7% 83.8% (0.9)% (0.8)% 84.8% 83.0%
Administrative expense ratios:
Health Plan 12.5% 12.8% (0.4)% (0.2)% 12.1% 12.6%
Small Group 20.4% 20.7% (0.3)% (0.4)% 20.1% 20.3%
Total 15.0% 15.2% (0.4)% (0.3)% 14.6% 14.9%
(a) Reflects the previously discussed m edical, ad mi nistrative, asse t write-downs and other expenses of $90 million, $35 million and $ 460 million, re s p e c t i v e l y.
(b) Reflects the previously discussed m edical, ad mi ni strative, asset write-downs and other expenses of $73 million, $2 5 million and $ 34 mi ll ion, re s p e c t i v e l y.
1999 1998
(In thousands) Health Plan Small Group Total Health Plan Small Group Total
Beginning medical membership 4,494 1,702 6,196 4,610 1,597 6,207
Sales 588 436 1,024 610 571 1,181
Cancellations (778) (475) (1,253) (700) (466) (1,166)
TRICARE change (28) (28) (26) (26)
Ending medical membership 4,276 1,663 5,939 4,494 1,702 6,196
Ending specialty membership 477 2,484 2,961 444 2,189 2,633
The following table presents certain financial data for the
Company’s two segments for the years ended December 31,
1999 and 1998:
(In millions) 1999 (a) 1998 (b)
Premium revenues:
Health Plan $ 6,827 $ 6,734
Small Group 3,132 2,863
$ 9,959 $ 9,597
Adjusted income (loss) before income taxes:
Health Plan $ 184 $ 304
Small Group (3) 31
$ 181 $ 335
Adjusted medical expense ratios:
Health Plan 86.4% 84.4%
Small Group 81.2% 79.7%
84.8% 83.0%
Adjusted administrative expense ratios:
Health Plan 12.1% 12.6%
Small Group 20.1% 20.3%
14.6% 14.9%
(a) Excludes the previously discussed medical expenses of $9 0 mill ion ($66 million Health
(a) Plan and $24 million Small Group), administra tive expenses of $35 million ($27 million
(a) Health Plan and $8 million Small G ro up) and asset writ e-downs and other expenses of
(a) $460 million ($460 million Health Pla n).
(b) Excludes the previously discussed medica l exp enses of $73 million ($60 million Health
(a) Plan and $13 million Small Group), adm inistra tive expe nses of $2 5 mil lion ($13 million
(a) Health Plan and $12 million Small Group) and asset w rite-downs and other expenses of
(a) $34 million ($23 million Health Pl an and $ 11 million Sm all G ro u p ) .
Health Plan
Adjusted income before income taxes totaled $184 million
for 1999 compared to $304 million for 1998. The earnings
decline was attributable to higher medical cost trends
which were not adequately anticipated by the Company
when it established premium rates for 1999. These higher
medical cost trends primarily resulted from ineffective risk-
sharing arrangements, pharmacy cost increases and the
result of unfavorable negotiations of the Florida
Columbia/HCAprovider contract. Initiatives to mitigate
the effect of these issues include significant large group
commercial rate increases, re-contracting with, or
eliminating certain risk-sharing providers, implementing
three-tier pharmacy benefit designs, instituting Medicare
HMO member premium and benefit changes and exiting
various Medicare markets. These initiatives began to
improve operating results in the second half of 1999 but
in large part will be realized in January 2000 when the
majority of the Company’s large group commercial
customers renew and when the Company’s Medicare
product offerings were adjusted.
The Health Plan segment’s premium revenues increased 1.4
percent to $6.8 billion for 1999. Large group commercial
and Medicare HMO premiums remained unchanged at $2.3
billion and $2.9 billion, respectively. Higher premium yields
of 5.5 percent and 3.4 percent for the large group
commercial and Medicare HMO lines, respectively, were
offset by membership reductions. Large group commercial
membership decreased 139,200 from 1998 reflecting the
effects of the Company’s commercial premium pricing
actions intended to maintain profitability. Medicare HMO
membership decreased 13,500 members from the exit of the
Treasure Coast and Sarasota, Florida markets. The Medicare
HMO membership reduction from market exits was
somewhat mitigated by increased membership achieved
through the redirecting of sales and marketing efforts
focused on key Medicare markets like Chicago, Tampa and
South Florida. The Company’s Medicaid premiums
increased 8.8 percent to $603 million for 1999 compared to
$554 million in 1998. This increase resulted from the more
favorable rates obtained from the renewal of the
Company’s contract with the Health Insurance