Humana 1999 Annual Report Download - page 22
Download and view the complete annual report
Please find page 22 of the 1999 Humana annual report below. You can navigate through the pages in the report by either clicking on the pages listed below, or by using the keyword search tool below to find specific information within the annual report.-
 1
1 -
2
-
3
-
4
-
5
-
6
-
7
-
8
-
9
-
10
-
11
-
 12
12 -
 13
13 -
 14
14 -
 15
15 -
 16
16 -
 17
17 -
 18
18 -
 19
19 -
 20
20 -
 21
21 -
 22
22 -
 23
23 -
 24
24 -
 25
25 -
 26
26 -
 27
27 -
 28
28 -
 29
29 -
 30
30
 |
 |

Options to purchase 9,427,060, 1,562,949 and 2,414,148
shares for the years ended December 31, 1999, 1998 and
1997, respectively, were not included in the computation of
(loss) earnings per common share-assuming dilution due to
the Company’s loss in 1999 and because the options’
exercise prices were greater than the average market price
of the Company’s common stock in 1998 and 1997.
Reclassifications
Certain reclassifications have been made to the prior years’
consolidated financial statements to conform with the
current year presentation.
Recently Issued Accounting Pronouncements
In June 1998, the Financial Accounting Standards Board
issued Statement of Financial Accounting Standards No.
133, “Accounting for Derivative Instruments and Hedging
Activities” (“SFAS No. 133”). In general, SFAS No. 133
requires that all derivatives be recognized as either assets or
liabilities in the balance sheet at their fair value, and sets
forth the manner in which gains or losses thereon are
to be recorded. The treatment of such gains or losses is
dependent upon the type of exposure, if any, for which the
derivative is designated as a hedge. This standard is
effective for the Company’s financial statements
beginning January 1, 2001, with early adoption permitted.
Management of the Company anticipates that the adoption
of SFAS No. 133 on January 1, 2001 will not have a material
impact on the Company’s financial position, results of
operations or cash flows.
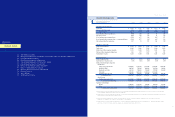
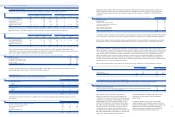
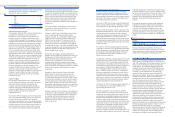
3. A S S E T W RI TE -D O W NS A ND OPER ATIONA L EXPE NSE S
The following table presents the components of the asset
write-downs and operational expenses and their respective
classifications in the 1999 and 1998 Consolidated Statements
of Operations:
41
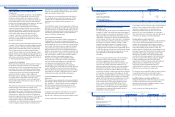
Long-Lived Assets
Property and equipment is carried at cost, and is comprised
of the following at December 31, 1999 and 1998:
(In millions) 1999 1998
Land $ 32 $ 33
Buildings 364 355
Equipment and computer software 432 400
828 788
Accumulated depreciation (410) (355)
$ 418 $ 433
Depreciation is computed using the straight-line method
over estimated useful lives ranging from three to ten years
for equipment, three to five years for computer software
and twenty years for buildings. Depreciation expense was
$79 million, $75 million and $66 million for the years ended
December 31, 1999, 1998 and 1997, respectively.
Cost in excess of net assets acquired, or goodwill,
represents the unamortized excess of cost over the fair
value of net tangible and identifiable intangible assets
acquired. Identifiable intangible assets, which are included
in other long-term assets in the accompanying Consolidated
Balance Sheets, primarily relate to subscriber and provider
contracts. Goodwill and identifiable intangible assets are
amortized on a straight-line method over their estimated
useful lives. Goodwill has been amortized over periods
ranging from six to 40 years and identifiable intangible
assets are being amortized over periods ranging from seven
to 14 years. After a re-evaluation, effective January 1, 2000,
the Company adopted a 20 year amortization period from
the date of acquisition for goodwill previously amortized
over 40 years. Amortization expense was $45 million,
$53 million and $42 million for the years ended December
31, 1999, 1998 and 1997, respectively.
The carrying values of all long-lived assets are periodically
reviewed by management for impairment, based upon
undiscounted market level cash flows, whenever adverse
events or changes in circumstances occur. Losses are
recognized when the carrying value of a long-lived asset
may not be recoverable. See Note 3 for a discussion related
to the Company’s impairment review.
Revenue and Medical Cost Recognition
Premium revenues are recognized as income in the period
members are entitled to receive services. Premiums
received prior to such period are recorded as unearned
premium revenues.
Medical costs include claim payments, capitation payments,
physician salaries, allocations of certain centralized
expenses and various other costs incurred to provide
medical care to members, as well as estimates of future
payments to hospitals and others for medical care provided
prior to the balance sheet date. Capitation payments
represent monthly prepaid fees disbursed to participating
primary care physicians and other providers who are
responsible for providing medical care to members. The
estimates of future medical claim and other expense
payments are developed using actuarial methods and
assumptions based upon payment patterns, medical
inflation, historical development and other relevant factors.
Estimates of future payments relating to services incurred
in the current and prior periods are continually reviewed
by management and adjusted as necessary.
The Company assesses the profitability of its contracts for
providing health care services to its members when current
market operating results or forecasts indicate probable
future losses. The Company records a premium deficiency
in current operations to the extent that the sum of expected
health care costs, claim adjustment expenses and
maintenance costs exceeds related future premiums.
Anticipated investment income is not considered for
purposes of computing the premium deficiency. Because
the majority of the Company’s member contracts renew
annually, the Company does not anticipate premium
deficiencies, except when unanticipated adverse events or
changes in circumstances indicate otherwise. See Note 3 for
a discussion related to premium deficiencies.
Management believes the Company’s medical and other
expenses payable are adequate to cover future claims
payments required, however, such estimates are based on
knowledge of current events and anticipated future events,
and, therefore, the actual liability could differ from
amounts provided.
Book Overdraft
Under the Company’s cash management system, checks
issued but not presented to banks frequently result in
overdraft balances for accounting purposes and are
classified as a current liability in the Consolidated
Balance Sheets.
Stock Options
The Company has adopted the disclosure-only provisions
of Statement of Financial Accounting Standards No. 123,
“Accounting for Stock-Based Compensation” (“SFAS 123”)
and uses Accounting Principles Board Opinion No. 25 and
related interpretations in the accounting for its stock option
plans. No compensation expense has been recognized in
connection with the granting of stock options. See Note 8
for discussion of stock options and the disclosures required
by SFAS 123.
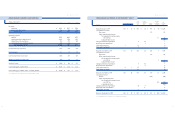
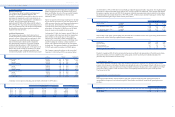
(Loss) Earnings Per Common Share
Detail supporting the computation of (loss) earnings per
common share and (loss) earnings per common share-
assuming dilution follows:
40
HU M A N A IN C .
NOTES TO CONSOLIDATED FINANCIAL STAT E M E N T S
(Dollars in millions, except per share results) Net (Loss) Income Shares Per Share Results
YE A R E N D E D D E C E M B E R 3 1 , 1 9 9 9
Loss per common share $ (382) 167,555,917 $ (2.28)
Effect of dilutive stock options
Loss per common share – assuming dilution $ (382) 167,555,917 $ (2.28)
YE A R E N D E D D E C E M B E R 3 1 , 1 9 9 8
Earnings per common share $ 129 166,471,824 $ 0.77
Effect of dilutive stock options 1,792,756
Earnings per common share – assuming dilution $ 129 168,264,580 $ 0.77
YE A R E N D E D D E C E M B E R 3 1 , 1 9 9 7
Earnings per common share $ 173 163,406,460 $ 1.06
Effect of dilutive stock options 2,436,019 (0.01)
Earnings per common share – assuming dilution $ 173 165,842,479 $ 1.05
Selling, Asset
General and Write-Downs
(In millions) Medical Administrative and Other Total
1999:
FI R S T Q U A R T E R 1 9 9 9 :
Premium deficiency $ 50 $ 50
Reserve strengthening 35 35
Provider costs 5 5
Total first quarter 1999 90 90
F O U R T H Q UA RT ER 1 999 :
Long-lived asset impairment $ 342 342
Losses on non-core asset sales 118 118
Professional liability reserve strengthening and other costs $ 35 35
Total fourth quarter 1999 35 460 495
Total 1999 $ 90 $ 35 $ 460 $ 585
1998:
THIRD QUARTER 1998:
Premium deficiency $ 46 $ 46
Provider costs 27 27
Market exit costs $ 15 15
Losses on non-core asset sales 12 12
Merger dissolution costs 7 7
Non-officer employee incentive and other costs $ 25 25
Total third quarter 1998 $ 73 $ 25 $ 34 $ 132