Humana 1999 Annual Report Download - page 24
Download and view the complete annual report
Please find page 24 of the 1999 Humana annual report below. You can navigate through the pages in the report by either clicking on the pages listed below, or by using the keyword search tool below to find specific information within the annual report.-
 1
1 -
2
-
3
-
4
-
5
-
6
-
7
-
8
-
9
-
10
-
11
-
12
-
13
-
 14
14 -
 15
15 -
 16
16 -
 17
17 -
 18
18 -
 19
19 -
 20
20 -
 21
21 -
 22
22 -
 23
23 -
 24
24 -
 25
25 -
 26
26 -
 27
27 -
 28
28 -
 29
29 -
 30
30
 |
 |

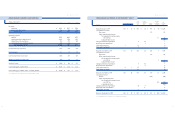
Deferred income tax balances reflect the impact of temporary differences between the carrying amounts of assets and
liabilities and their tax bases, and are stated at enacted tax rates expected to be in effect when taxes are actually paid or
recovered. Principal components of the net deferred tax balances for the Company at December 31, 1999 and 1998 are
as follows:
Assets (Liabilities)
(In millions) 1999 1998
Marketable securities $ 18 $ (8)
Long-term assets (55) (46)
Medical and other expenses payable 95 95
Asset write-downs and operational expenses 36 16
Professional liability risks 9 7
Net operating loss carryforwards 58 58
Workers’ compensation liabilities 25 40
Compensation and other accruals 29 31
$ 215 $ 193
At December 31, 1999, the Company has available tax net operating loss carryforwards of approximately $150 million related
to prior acquisitions. These loss carryforwards, if unused to offset future taxable income, will expire in 2000 through 2011.
Based on the Company’s historical taxable income record and estimates of future profitability, management has concluded
that operating income will more likely than not be sufficient to give rise to tax expense to recover all deferred tax assets.
6. DE B T
The Company maintains a revolving credit agreement (“Credit Agreement”) which provides a line of credit of up to $1.0
billion and expires in August 2002. Principal amounts outstanding under the Credit Agreement bear interest at either a fixed
rate or a floating rate, ranging from LIBOR plus 35 basis points to LIBOR plus 80 basis points, depending on the Company’s
credit ratings. The Credit Agreement, which was amended in 1999 to reduce the line of credit by $500 million from $1.5
billion and modify certain covenants, contains customary covenants and events of default including, but not limited to,
financial tests for interest coverage and leverage. The Company is in compliance with all covenants. The Company also
maintains and issues short-term debt securities under a commercial paper program. The carrying value of commercial paper
approximates fair value due to its short-term maturity.
Borrowings and the weighted average interest rate on those borrowings at December 31, 1999 and 1998 are as follows:
1999 1998
Weighted Average Weighted Average
(In millions) Amount Interest Rate Amount Interest Rate
Credit agreement 5.7% $ 93 5.9%
Commercial paper program $ 686 5.6% 730 5.9%
$ 686 $ 823
7. PRO F ES SIO N A L LI A BI LI TY AN D OT HER OB LI GAT I O N S
The components of professional liability and other obligations at December 31, 1999 and 1998 are as follows:
(In millions) 1999 1998
Allowance for professional liabilities $ 133 $ 123
Liabilities for disability and other long-term insurance products, the Company’s retirement and benefit plans and other 44 53
Less: current portion of allowance for professional liabilities (33) (22)
$ 144 $ 154
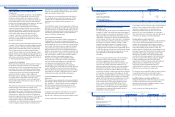
The Company insures substantially all professional
liability risks through a wholly owned subsidiary (the
“Subsidiary”). Provisions for such risks, including expenses
incident to claim settlements, were $57 million, $27 million
and $32 million for the years ended December 31, 1999,
1998 and 1997, respectively. The amount for 1999 includes
$25 million of professional liability reserve strengthening
discussed in Note 3. The Subsidiary reinsures levels of
coverage for losses in excess of its retained limits with
unrelated insurance carriers. Reinsurance recoverables were
$29 million and $40 million at December 31, 1999 and 1998,
respectively. The current portion of allowance for
professional liabilities is included with trade accounts
payable and accrued expenses in the Consolidated
Balance Sheets.
In 1998, the Subsidiary entered into a loss portfolio
transfer agreement with unrelated insurance carriers for
approximately $39 million, providing for the transfer of all
professional and workers’ compensation liabilities on
claims incurred prior to December 31, 1997 limited to
individual and maximum claim retention levels.
4544
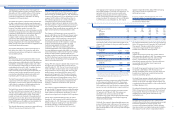
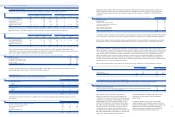
1999 1998
Gross Gross Gross Gross
Amortized Unrealized Unrealized Fair Amortized Unrealized Unrealized Fair
(In millions) Cost Gains Losses Value Cost Gains Losses Value
U.S. Government obligations $ 178 $ (3) $ 175 $ 165 $ 4 $ 169
Tax exempt municipal bonds 889 (24) 865 845 6 851
Corporate bonds 234 (7) 227 250 8 258
Redeemable preferred stocks 67 (2) 65 124 1 125
Marketable equity securities 96 $ 9 (6) 99 129 2 $ (2) 129
Other 77 (1) 76 59 3 62
$ 1,541 $ 9 $ (43) $ 1,507 $ 1,572 $ 24 $ (2) $ 1,594
Marketable securities classified as long-term assets at December 31, 1999 and 1998 included the following:
1999 1998
Gross Gross Gross Gross
Amortized Unrealized Unrealized Fair Amortized Unrealized Unrealized Fair
(In millions) Cost Gains Losses Value Cost Gains Losses Value
U.S. Government obligations $ 16 $ 16 $ 5 $ 5
Tax exempt municipal bonds 180 $ (7) 173 234 $ 4 $ (1) 237
Redeemable preferred stocks 27 (1) 26 31 31
Marketable equity securities 10 (1) 9 2 2
Other 29 29 30 30
$ 262 $ (9) $ 253 $ 302 $ 4 $ (1) $ 305
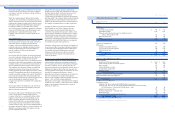
The contractual maturities of debt securities available for sale at December 31, 1999, regardless of their balance sheet
classification, are shown below. Expected maturities may differ from contractual maturities because borrowers may have the
right to call or prepay obligations with or without call or prepayment penalties.
Amortized Fair
(In millions) Cost Value
Due within one year $ 209 $ 207
Due after one year through five years 499 490
Due after five years through ten years 384 370
Due after ten years 210 204
Not due at a single maturity date 395 381
$ 1,697 $ 1,652
Gross realized investment gains were $18 million, $30 million and $11 million and gross realized investment losses were
$7 million, $9 million and $1 million in 1999, 1998 and 1997, respectively.
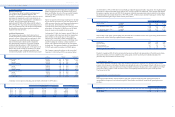
5. IN CO M E TA X E S
The (benefit) provision for income taxes consisted of the following:
Years Ended December 31,
(In millions) 1999 1998 1997
Current (benefit) provision:
Federal $ (18) $ 39 $ 51
State (9) 9 6
(27) 48 57
Deferred provision:
Federal 4 24 36
State 1 2 4
5 26 40
$ (22) $ 74 $ 97
The (benefit) provision for income taxes was different from the amount computed using the federal statutory rate due to
the following:
Years Ended December 31,
(In millions) 1999 1998 1997
Income tax (benefit) provision at federal statutory rate $ (142) $ 71 $ 95
State income taxes, net of federal benefit (16) 8 10
Tax exempt investment income (19) (18) (13)
Amortization 11 17 10
Long-lived asset impairment 143
Other 1 (4) (5)
$ (22) $ 74 $ 97
HU M A N A IN C .
NOTES TO CONSOLIDATED FIN ANCIAL STAT E M E N T S
4. M A R K ETA B L E S E CU R IT I ES
Marketable securities classified as current assets at December 31, 1999 and 1998 included the following: