Humana 1999 Annual Report Download - page 21
Download and view the complete annual report
Please find page 21 of the 1999 Humana annual report below. You can navigate through the pages in the report by either clicking on the pages listed below, or by using the keyword search tool below to find specific information within the annual report.-
 1
1 -
2
-
3
-
4
-
5
-
6
-
7
-
8
-
9
-
10
-
 11
11 -
 12
12 -
 13
13 -
 14
14 -
 15
15 -
 16
16 -
 17
17 -
 18
18 -
 19
19 -
 20
20 -
 21
21 -
 22
22 -
 23
23 -
 24
24 -
 25
25 -
 26
26 -
 27
27 -
 28
28 -
 29
29 -
 30
30
 |
 |

1. R E P O R T I N G E N T IT Y
Nature of Operations
Humana Inc. (the “Company” or “Humana”) is one of the
nation’s largest publicly traded health services companies
that facilitates the delivery of health care services through
networks of providers to its approximately 5.9 million
medical members. The Company’s products are marketed
primarily through health maintenance organizations
(“HMOs”) and preferred provider organizations (“PPOs”)
that encourage or require the use of contracted providers.
HMOs and PPOs control health care costs by various
means, including pre-admission approval for hospital
inpatient services, pre-authorization of outpatient surgical
procedures, and risk-sharing arrangements with providers.
These providers may share medical cost risk or have other
incentives to deliver quality medical services in a cost-
effective manner. The Company also offers various specialty
products to employers, including dental, group life and
workers’ compensation and administrative services
(“ASO”) to those who self-insure their employee health
plans. The Company has entered into a definitive
agreement to sell its workers’ compensation business. In
total, the Company’s products are licensed in 49 states, the
District of Columbia and Puerto Rico, with approximately
20 percent of its membership in the state of Florida.
During 1999, the Company realigned its organization to
achieve greater accountability in its lines of business. As a
result of this realignment, the Company organized into two
business units: the Health Plan segment and the Small
Group segment. The Health Plan segment includes the
Company’s large group commercial (100 employees and
over), Medicare, Medicaid, ASO, workers’ compensation
and military or TRICARE business. The small group
segment includes small group commercial (under 100
employees) and specialty benefit lines, including dental, life
and short-term disability. Results of each segment are
measured based upon results of operations before income
taxes. The Company allocates administrative expenses,
interest income and interest expense, but no assets, to the
segments. Members served by the two segments generally
utilize the same medical provider networks, enabling the
Company to obtain more favorable contract terms with
providers. As a result, the profitability of each segment is
somewhat interdependent. In addition, premium revenue
pricing to large group commercial employers has
historically been more competitive than that to small group
commercial employers, resulting in less favorable under-
writing margins for the large group commercial line of
business. Costs to distribute and administer products to
small group commercial employers are higher compared to
large group commercial employers resulting in small
group’s higher administrative expense ratio.
2. SU MMA R Y OF SI G N I FI C A N T A CC O U N T I N G P O L I C I E S
Consolidation
The consolidated financial statements include all
subsidiaries of the Company. All significant intercompany
accounts and transactions have been eliminated.
Use of Estimates in Preparation of Financial Statements
The preparation of financial statements in accordance
with generally accepted accounting principles requires
management to make estimates and assumptions that affect
the amounts reported in the financial statements and
accompanying notes. Although these estimates are based on
knowledge of current events and anticipated future events,
actual results may ultimately differ from those estimates.
Cash and Cash Equivalents
Cash and cash equivalents include cash, time deposits,
money market funds, commercial paper and certain U.S.
Government securities with an original maturity of three
months or less. Carrying value approximates fair value due
to the short-term maturity of the investments.
Marketable Securities
Marketable debt and equity securities have been
categorized as available for sale and, as a result, are stated
at fair value based generally on quoted market prices.
Marketable debt and equity securities available for current
operations are classified as current assets. Marketable
securities available for the Company’s capital spending,
professional liability, long-term insurance product require-
ments and payment of long-term workers’ compensation
claims are classified as long-term assets. Unrealized holding
gains and losses, net of applicable deferred taxes, are
included as a component of stockholders’ equity
until realized.
For the purpose of determining gross realized gains and
losses, the cost of securities sold is based upon specific
identification.
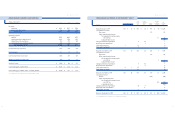
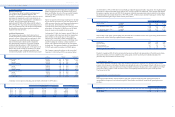
3938
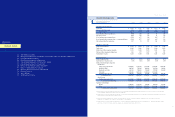
HU M A N A IN C ./
C O N S O L I D ATED STATEMENTS OF CASH FLOWS
(In millions)
For the years ended December 31, 1999 1998 1997
C A S H F L O W S FR OM O P E R ATI N G AC TI V IT I ES
Net (loss) income $ (382) $ 129 $ 173
Adjustments to reconcile net (loss) income
to net cash provided by operating activities:
Asset write-downs and other expenses 460 17
Depreciation and amortization 124 128 108
Gain on sale of property and equipment (12)
Gain on sale of marketable securities (11) (21) (10)
Deferred income taxes 5 26 40
Provision for doubtful accounts 12 11 10
Changes in operating assets and liabilities:
Premiums receivable 39 34 (112)
Other assets 54 32 (47)
Medical and other expenses payable (23) (22) (118)
Workers’ compensation liabilities (150) (134) (31)
Other liabilities 45 (135) 57
Unearned premium revenues 56 (10) 203
Other 6
Net cash provided by operating activities 217 55 279
C A S H F L O W S FR OM I N V ES TI N G A C TI VI T IE S
Acquisitions of health plan assets, net of cash acquired (14) (669)
Purchases of property and equipment (89) (104) (73)
Dispositions of property and equipment 54 12 15
Purchases of marketable securities (781) (1,037) (608)
Maturities of marketable securities 391 380 341
Proceeds from sales of marketable securities 472 815 317
Other (15) (38) 23
Net cash provided by (used in) investing activities 18 28 (654)
C A S H F L O W S FR OM F IN A N CI N G A C TI VI TI E S
Issuance of long-term debt 123 300
Repayment of long-term debt (93) (330)
Net commercial paper (repayments) borrowings (44) 141 367
Change in book overdraft (19) 82 (1)
Other (14) 35 13
Net cash (used in) provided by financing activities (170) 51 679
Increase in cash and cash equivalents 65 134 304
Cash and cash equivalents at beginning of period 913 779 475
Cash and cash equivalents at end of period $ 978 $ 913 $ 779
Supplemental cash flow disclosures:
Interest payments $ 33 $ 49 $ 15
Income tax (refunds) payments, net (58) 69 8
Details of businesses acquired in purchase transactions:
Fair value of assets acquired $ 20 $ 1,973
Less: liabilities assumed (6) (1,304)
Cash paid for acquired businesses, net of cash acquired $ 14 $ 669
Th e accompanying notes are an integral part of the con so lidated fi nanc ial statemen ts.
HU M A N A IN C .
NOTES TO CONSOLIDATED FINANCIAL STAT E M E N T S