Kohl's 2010 Annual Report Download - page 24
Download and view the complete annual report
Please find page 24 of the 2010 Kohl's annual report below. You can navigate through the pages in the report by either clicking on the pages listed below, or by using the keyword search tool below to find specific information within the annual report.-
 1
1 -
2
-
3
-
4
-
5
-
6
-
7
-
8
-
9
-
10
-
11
-
12
-
13
-
 14
14 -
 15
15 -
 16
16 -
 17
17 -
 18
18 -
 19
19 -
 20
20 -
 21
21 -
 22
22 -
 23
23 -
 24
24 -
 25
25 -
 26
26 -
 27
27 -
 28
28 -
 29
29 -
 30
30 -
 31
31 -
 32
32 -
 33
33 -
 34
34 -
35
-
36
-
37
-
38
-
39
-
40
-
41
-
42
-
43
-
44
-
45
-
46
-
47
-
48
-
49
-
50
-
51
-
52
-
53
-
54
-
55
-
56
-
57
-
58
-
59
-
60
-
61
-
62
-
63
-
64
-
65
-
66
-
67
-
68
-
69
-
70
-
71
-
72
-
73
-
74
-
75
-
76
 |
 |

Table of Contents
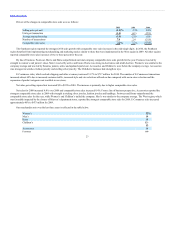
Gross margin $6,498 $6,055
As a percent of net sales 37.8% 36.9%
Gross margin includes the total cost of products sold, including product development costs, net of vendor payments other than reimbursement of
specific, incremental and identifiable costs; inventory shrink; markdowns; freight expenses associated with moving merchandise from our vendors to our
distribution centers; shipping and handling expenses of E-Commerce sales; and terms cash discount. Our gross margin may not be comparable with that of
other retailers because we include distribution center costs in selling, general and administrative expenses while other retailers may include these expenses in
cost of merchandise sold.
Gross margin increased $534 million, or 8.2%, in 2010 compared to 2009. Gross margin as a percentage of sales increased 41 basis points to 38.2 %
for 2010. Strong inventory management and increased penetration of private and exclusive brands contributed to the margin strength. Average inventory per
store at year-end 2010 is approximately one percent higher than 2009. Clearance inventory units per store are approximately 12% lower this year than in 2009.
Sales of private and exclusive brands reached 48% of net sales for 2010, an increase of approximately 290 basis points over 2009. Approximately 80 percent
of our merchandise receipts are now subject to our size-optimization programs which has also had a positive impact on our gross margin rate.
Merchandise costs across all apparel categories are expected to be up approximately 10 to 15% overall for Fall 2011 due to inflation in the cost of raw
materials, labor and fuel. Specific increases are dependent on the category and the related fabric content. We have been preparing for these cost increases for
some time and are working diligently to minimize the impact of these higher costs on a consumer that is still buying cautiously and, therefore, less open to
paying higher prices for discretionary goods.
Gross margin for 2009 increased $443 million, or 7.3%, over 2008. The improvement in gross margin as a percent of net sales for 2009 compared to
2008 was driven by strong merchandise and inventory management and increased penetration of private and exclusive brands. Sales of private and exclusive
brands reached 44% of net sales in 2009, an increase of 220 basis points over 2008.
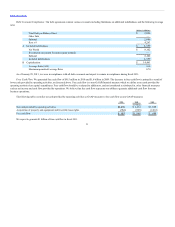
Selling, general, and administrative expenses $4,196 $3,978
As a percent of net sales 24.4% 24.3%
Selling, general and administrative expenses (“SG&A”) include compensation and benefit costs (including stores, headquarters, buying and
merchandising and distribution centers); occupancy and operating costs of our retail, distribution and corporate facilities; freight expenses associated with
moving merchandise from our distribution centers to our retail stores and among distribution and retail facilities; advertising expenses, offset by vendor
payments for reimbursement of specific, incremental and identifiable costs; net revenues from our Kohl’s credit card operations; and other administrative
costs. SG&A also includes the costs incurred prior to new store openings, such as advertising, hiring and training costs for new employees, processing and
transporting initial merchandise, and rent expense. We do not include depreciation and amortization in SG&A. The classification of these expenses varies
across the retail industry.
SG&A for 2010 increased $266 million, or 6.3%, over 2009, but decreased as a percentage of net sales, or “leveraged.” SG&A increased primarily due
to store growth, higher sales, and investments in technology and infrastructure related to our E-Commerce business.
24