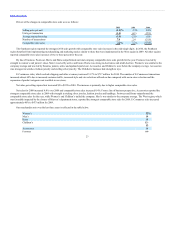
Kohl's 2010 Annual Report Download - page 27
Download and view the complete annual report
Please find page 27 of the 2010 Kohl's annual report below. You can navigate through the pages in the report by either clicking on the pages listed below, or by using the keyword search tool below to find specific information within the annual report.-
 1
1 -
2
-
3
-
4
-
5
-
6
-
7
-
8
-
9
-
10
-
11
-
12
-
13
-
14
-
15
-
16
-
 17
17 -
 18
18 -
 19
19 -
 20
20 -
 21
21 -
 22
22 -
 23
23 -
 24
24 -
 25
25 -
 26
26 -
 27
27 -
 28
28 -
 29
29 -
 30
30 -
 31
31 -
 32
32 -
 33
33 -
 34
34 -
 35
35 -
 36
36 -
 37
37 -
38
-
39
-
40
-
41
-
42
-
43
-
44
-
45
-
46
-
47
-
48
-
49
-
50
-
51
-
52
-
53
-
54
-
55
-
56
-
57
-
58
-
59
-
60
-
61
-
62
-
63
-
64
-
65
-
66
-
67
-
68
-
69
-
70
-
71
-
72
-
73
-
74
-
75
-
76
 |
 |

Table of Contents
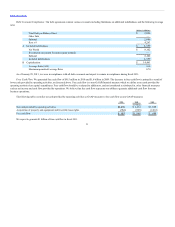
sources of financing. We expect to generate adequate cash flow from operating activities to sustain current levels of operations.
As of January 29, 2011, we had cash and cash equivalents of $2.3 billion. We generated $915 million of free cash flow in 2010 and expect to generate
$1 billion in 2011. (See the Free Cash Flow discussion later in this Liquidity and Capital Resources section for additional discussion of free cash flow, a non-
GAAP financial measure.)
Operating activities $2,234 $1,698
Investing activities (640) (963)
Financing activities 30 (273)
Cash provided by operations decreased 25% in 2010 to $1.7 billion.
At January 29, 2011, total merchandise inventories increased $113 million, or 4%, from year-end 2009. On a dollars per store basis, merchandise
inventories at January 29, 2011 increased 0.9% from year-end 2009. Clearance inventory units per store are down approximately 12%. These changes reflect
our various inventory management initiatives, including our conservative sales and receipt planning and lower clearance levels.
Accounts payable at January 29, 2011 decreased $50 million from year-end 2009, compared to increasing $306 million from year-end 2008 to 2009.
The change is primarily due to vendor finance initiatives which are now fully implemented. In prior years, we rolled out a receivable financing program
whereby a financial institution provides our vendors with financing, at a rate which is below what the vendors could normally obtain on their own. We offer
this program to vendors in exchange for extended payment terms. We do not incur any costs or expenses or forfeit any portion of our receivables in connection
with this program. Timing of inventory purchases also contributed to the change.
Accounts payable as a percent of inventory was 37.5% at January 29, 2011, compared to 40.6% at year-end 2009. It has been more than a year since
we implemented our vendor finance initiatives, so we no longer expect to see the significant improvement in this metric that we have seen in the past. Lower
inventory turn also contributed to the decrease.
Cash provided by operations increased 32% over 2008 to $2.2 billion in 2009, primarily due to a $258 million increase in cash flows from accounts
payable activities. Accounts payable at January 30, 2010 increased $306 million from year-end 2008. Accounts payable as a percent of inventory was 40.6%
at January 30, 2010, compared to 31.5% at year-end 2008, primarily due to strong inventory management, our cycle time reduction initiatives and improved
vendor financing management. Short-term trade credit, in the form of extended payment terms for inventory purchases, represents a significant source of
financing for merchandise inventories. Compared to year-end 2008, total merchandise inventories at January 30, 2010 increased 4% and inventory per store
decreased 0.9%. Clearance inventory units per store were down approximately 14%. These reductions were the result of inventory management initiatives,
including our conservative sales and receipt planning and lower clearance levels.
Net cash used in investing activities increased $77 million to $717 million in 2010, primarily due to an increase in capital expenditures.
Capital expenditures totaled $761 million for 2010, a $95 million increase over 2009. This increase is primarily due to higher capital spending as a
result of increased remodels, the opening of our second E-Commerce fulfillment center and planned incremental IT investments to support our E-Commerce
business. These increases were partially offset by reductions in capital spending for new stores.
27