Kohl's 2010 Annual Report Download - page 58
Download and view the complete annual report
Please find page 58 of the 2010 Kohl's annual report below. You can navigate through the pages in the report by either clicking on the pages listed below, or by using the keyword search tool below to find specific information within the annual report.-
 1
1 -
2
-
3
-
4
-
5
-
6
-
7
-
8
-
9
-
10
-
11
-
12
-
13
-
14
-
15
-
16
-
17
-
18
-
19
-
20
-
21
-
22
-
23
-
24
-
25
-
26
-
27
-
28
-
29
-
30
-
31
-
32
-
33
-
34
-
35
-
36
-
37
-
38
-
39
-
40
-
41
-
42
-
43
-
44
-
45
-
46
-
47
-
 48
48 -
 49
49 -
 50
50 -
 51
51 -
 52
52 -
 53
53 -
 54
54 -
 55
55 -
 56
56 -
 57
57 -
 58
58 -
 59
59 -
 60
60 -
 61
61 -
 62
62 -
 63
63 -
 64
64 -
 65
65 -
 66
66 -
 67
67 -
 68
68 -
69
-
70
-
71
-
72
-
73
-
74
-
75
-
76
 |
 |

Table of Contents
The fair value for our ARS is based on third-party pricing models and is classified as a Level 3 pricing category. We utilized a discounted cash flow
model to estimate the current fair market value for each of the securities we owned as there was no recent activity in the secondary markets in these types of
securities. This model used unique inputs for each security including discount rate, interest rate currently being paid and maturity. The discount rate was
calculated using the closest match available for other insured asset backed securities. A market failure scenario was employed as recent successful auctions of
these securities were very limited.
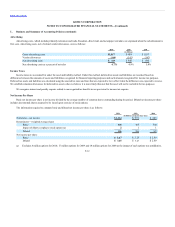
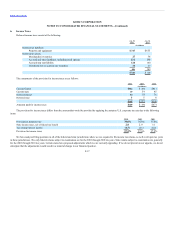
The following table presents a rollforward of our long-term ARS, all of which are measured at fair value on a recurring basis using unobservable inputs
(Level 3):
Balance at beginning of year $332
Sales (28)
Unrealized gains / (losses) 16
Balance at end of year $320
Unrealized gains / (losses) are reported net of deferred taxes of $1 million at January 29, 2011 and $6 million at January 30, 2010 as a component of
Accumulated Other Comprehensive Gain (Loss) in the Consolidated Statements of Changes in Shareholders’ Equity.
.
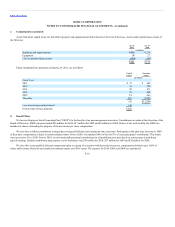
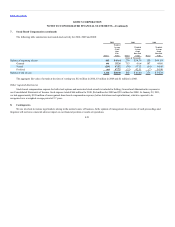
Long-term debt consists of the following:
Non-callable and unsecured senior debt:
March 2011 6.32% $300
October 2011 7.41% 100
2017 6.31% 650
2029 7.36% 200
2033 6.05% 300
2037 6.89% 350
Total senior debt 6.55% 1,900
Capital lease obligations 174
Unamortized debt discount (6)
Less current portion (16)
Long-term debt and capital leases $2,052
Based on quoted market prices (Level 1 per ASC No. 820, “Fair Value Measurements and Disclosures”), the estimated fair value of our senior debt was
approximately $2.1 billion at both January 29, 2011 and January 30, 2010.
F-14