Kohl's 2010 Annual Report Download - page 63
Download and view the complete annual report
Please find page 63 of the 2010 Kohl's annual report below. You can navigate through the pages in the report by either clicking on the pages listed below, or by using the keyword search tool below to find specific information within the annual report.-
 1
1 -
2
-
3
-
4
-
5
-
6
-
7
-
8
-
9
-
10
-
11
-
12
-
13
-
14
-
15
-
16
-
17
-
18
-
19
-
20
-
21
-
22
-
23
-
24
-
25
-
26
-
27
-
28
-
29
-
30
-
31
-
32
-
33
-
34
-
35
-
36
-
37
-
38
-
39
-
40
-
41
-
42
-
43
-
44
-
45
-
46
-
47
-
48
-
49
-
50
-
51
-
52
-
 53
53 -
 54
54 -
 55
55 -
 56
56 -
 57
57 -
 58
58 -
 59
59 -
 60
60 -
 61
61 -
 62
62 -
 63
63 -
 64
64 -
 65
65 -
 66
66 -
 67
67 -
 68
68 -
 69
69 -
 70
70 -
 71
71 -
 72
72 -
 73
73 -
74
-
75
-
76
 |
 |
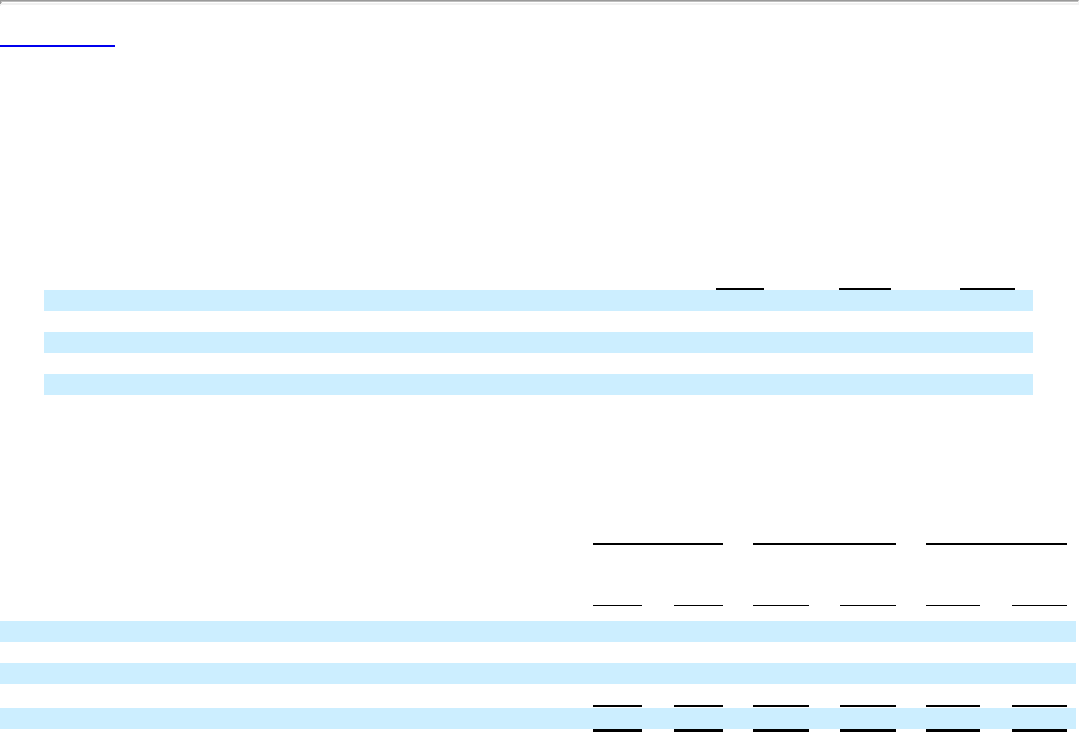
Table of Contents
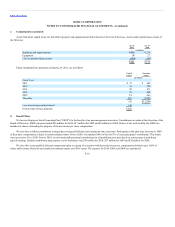
years. Outstanding options granted to employees prior to 2006 have a term of up to 15 years. Options granted to directors have a term of 10 years.
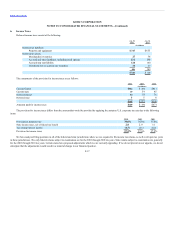
All stock options have an exercise price equal to the fair market value of the common stock on the date of grant. The fair value of each option award is
estimated using a Black-Scholes option valuation model and the following assumptions as of the grant date:
Dividend yield 0% 0%
Volatility 42.8% 36.6%
Risk-free interest rate 1.8% 2.5%
Expected life in years 5.4 5.3
Weighted average fair value at grant date $17.68 $15.52
The dividend yield represents the expected dividends on our stock for the expected term of the option. The expected volatility assumption is based on the
historical volatility of our stock. The risk-free interest rate for periods within the life of the option is based on a blend of U.S. Treasury bond rates. We use
historical data to estimate the expected life of the option and the period of time that options granted are expected to be outstanding.
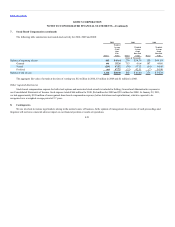
The following table summarizes our stock option activity for 2010, 2009, and 2008:
Balance at beginning of year 19,134 $53.01 17,313 $55.79
Granted 3,034 42.88 3,568 41.93
Exercised (1,273) 39.83 (135) 40.87
Forfeited/expired (1,047) 56.79 (1,612) 59.37
Balance at end of year 19,848 $ 52.10 19,134 $53.01
The intrinsic value of options exercised represents the excess of our stock price at the time the option was exercised over the exercise price and was $25
million in 2010, $20 million in 2009 and $1 million in 2008.
F-19