Kohl's 2010 Annual Report Download - page 28
Download and view the complete annual report
Please find page 28 of the 2010 Kohl's annual report below. You can navigate through the pages in the report by either clicking on the pages listed below, or by using the keyword search tool below to find specific information within the annual report.-
 1
1 -
2
-
3
-
4
-
5
-
6
-
7
-
8
-
9
-
10
-
11
-
12
-
13
-
14
-
15
-
16
-
17
-
 18
18 -
 19
19 -
 20
20 -
 21
21 -
 22
22 -
 23
23 -
 24
24 -
 25
25 -
 26
26 -
 27
27 -
 28
28 -
 29
29 -
 30
30 -
 31
31 -
 32
32 -
 33
33 -
 34
34 -
 35
35 -
 36
36 -
 37
37 -
 38
38 -
39
-
40
-
41
-
42
-
43
-
44
-
45
-
46
-
47
-
48
-
49
-
50
-
51
-
52
-
53
-
54
-
55
-
56
-
57
-
58
-
59
-
60
-
61
-
62
-
63
-
64
-
65
-
66
-
67
-
68
-
69
-
70
-
71
-
72
-
73
-
74
-
75
-
76
 |
 |

Table of Contents
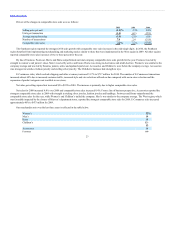
Capital expenditures, including favorable lease rights, by major category were as follows:
New stores 54% 68
Remodels/relocations 16 12
Distribution centers — 4
Capitalized software 9 5
Fixtures and store improvements 9 4
Other 12 7
Total 100% 100
We expect total capital expenditures of approximately $1 billion in fiscal 2011 due primarily to an increase in new store openings (40 expected in 2011
compared to 31 in 2010). An increase in store remodels (approximately 100 expected in 2011 compared to 85 in 2010), construction of a third fulfillment center
to support our E-Commerce business and the roll out of electronic signs to additional stores will also contribute to the increase. The actual amount of our future
capital expenditures will depend primarily on the number of new stores opened, the mix of owned, leased or acquired stores, the number of stores remodeled
and the timing of distribution center openings. We do not anticipate that our expansion plans will be limited by any restrictive covenants in our financing
agreements. We believe that our capital structure is well positioned to support our expansion plans. We anticipate that internally generated cash flows will be the
primary source of funding for future growth.
Sales of long-term investments generated cash of $42 million in 2010 and $28 million in 2009. As of January 29, 2011, we had investments in auction
rate securities (“ARS”) with a par value of $337 million and an estimated fair value of $276 million. ARS are long-term debt instruments with interest rates
reset through periodic short term auctions, which are typically held every 35 days. Beginning in February 2008, liquidity issues in the global credit markets
resulted in the failure of auctions for all of our ARS. A “failed” auction occurs when the amount of securities submitted for sale in the auction exceeds the
amount of purchase bids. As a result, holders are unable to liquidate their investment through the auction. A failed auction is not a default of the debt
instrument, but does set a new interest rate in accordance with the terms of the debt instrument. A failed auction limits liquidity for holders until there is a
successful auction or until such time as another market for ARS develops. ARS are generally callable by the issuer at any time. Scheduled auctions continue to
be held until the ARS matures or is called.
To date, we have collected all interest payable on outstanding ARS when due and expect to continue to do so in the future. Substantially all redemptions
to date were made at par. At this time, we have no reason to believe that any of the underlying issuers of our ARS or their insurers are presently at risk or that
the reduced liquidity has had a significant impact on the underlying credit quality of the assets backing our ARS. While the auction failures limit our ability to
liquidate these investments, we believe that the ARS failures will have no significant impact on our ability to fund ongoing operations and growth initiatives.
Net cash used in investing activities decreased $323 million to $640 million in 2009, primarily due to a decrease in capital expenditures. Capital
expenditures totaled $666 million for 2009, a $348 million decrease from 2008. This decrease is primarily due to a decrease in the number of new store
openings from 75 in 2008 to 56 in 2009.
Our financing activities used cash of $949 million in 2010 and provided cash of $30 million in 2009. The change is primarily due to treasury stock
purchases in the fourth quarter of 2010.
28