Kohl's 2010 Annual Report Download - page 30
Download and view the complete annual report
Please find page 30 of the 2010 Kohl's annual report below. You can navigate through the pages in the report by either clicking on the pages listed below, or by using the keyword search tool below to find specific information within the annual report.-
 1
1 -
2
-
3
-
4
-
5
-
6
-
7
-
8
-
9
-
10
-
11
-
12
-
13
-
14
-
15
-
16
-
17
-
18
-
19
-
 20
20 -
 21
21 -
 22
22 -
 23
23 -
 24
24 -
 25
25 -
 26
26 -
 27
27 -
 28
28 -
 29
29 -
 30
30 -
 31
31 -
 32
32 -
 33
33 -
 34
34 -
 35
35 -
 36
36 -
 37
37 -
 38
38 -
 39
39 -
 40
40 -
41
-
42
-
43
-
44
-
45
-
46
-
47
-
48
-
49
-
50
-
51
-
52
-
53
-
54
-
55
-
56
-
57
-
58
-
59
-
60
-
61
-
62
-
63
-
64
-
65
-
66
-
67
-
68
-
69
-
70
-
71
-
72
-
73
-
74
-
75
-
76
 |
 |

Table of Contents
debt/capitalization ratio was comparable to 2009, as share repurchases offset earnings in equity. The ratio of earnings to fixed charges was consistent with
prior years. See Exhibit 12.1 to this Annual Report on Form 10-K for the calculation of this ratio.
The increase in working capital and the current ratio as of year-end 2009 compared to year-end 2008 was primarily due to higher cash and cash
equivalents. The decrease in the debt/capitalization ratio reflects higher capitalization, primarily due to earnings. The 2009 ratio of earnings to fixed charges
was comparable to 2008.
Our Return on Gross Investment (“ROI”) was 18.7% for 2010, 17.7% for 2009 and 16.9% for 2008. The increases were primarily due to higher
earnings. ROI is a non-GAAP financial measure which we define as earnings before interest, taxes, depreciation, amortization and rent (“EBITDAR”) divided
by average gross investment. Our ROI calculation may not be comparable to similarly titled measures reported by other companies. ROI should be evaluated in
addition to, and not considered a substitute for, other financial measures such as return on assets. We believe that ROI measures how effectively we utilize our
assets, excluding cash equivalents and long-term investments, to generate earnings.
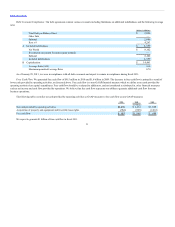
The following table includes our ROI and return on assets (the most comparable GAAP measure) calculations:
Net income $991 $885
Rent expense 498 448
Depreciation and amortization 590 541
Net interest 124 111
Provision for income taxes 597 540
EBITDAR $2,800 $2,525
Average: (1)
Total assets $12,299 $11,066
Cash equivalents and long-term investments (2) (1,434) (513)
Goodwill (9) (9)
Deferred tax assets (72) (71)
Accumulated depreciation (3) 2,824 2,364
Capitalized rent (4) 4,832 4,306
Accounts payable (1,259) (1,066)
Accrued liabilities (888) (786)
Other long-term liabilities (443) (383)
Gross Investment (“AGI”) $15,850 $ 14,908
8.1% 8.0%
17.7% 16.9%
(1) Represents average of 5 most recent quarter end balances
(2) Represents excess cash not required for operations
(3) Includes property and equipment and favorable lease rights
(4) Represents 10 times store rent expense and 5 times equipment/other rent
(5) Net income divided by Average total assets
(6) EBITDAR divided by Gross Investment
30