Kohl's 2010 Annual Report Download - page 25
Download and view the complete annual report
Please find page 25 of the 2010 Kohl's annual report below. You can navigate through the pages in the report by either clicking on the pages listed below, or by using the keyword search tool below to find specific information within the annual report.-
 1
1 -
2
-
3
-
4
-
5
-
6
-
7
-
8
-
9
-
10
-
11
-
12
-
13
-
14
-
 15
15 -
 16
16 -
 17
17 -
 18
18 -
 19
19 -
 20
20 -
 21
21 -
 22
22 -
 23
23 -
 24
24 -
 25
25 -
 26
26 -
 27
27 -
 28
28 -
 29
29 -
 30
30 -
 31
31 -
 32
32 -
 33
33 -
 34
34 -
 35
35 -
36
-
37
-
38
-
39
-
40
-
41
-
42
-
43
-
44
-
45
-
46
-
47
-
48
-
49
-
50
-
51
-
52
-
53
-
54
-
55
-
56
-
57
-
58
-
59
-
60
-
61
-
62
-
63
-
64
-
65
-
66
-
67
-
68
-
69
-
70
-
71
-
72
-
73
-
74
-
75
-
76
 |
 |

Table of Contents
Hourly store payroll costs leveraged in 2010 and continue to be driven by sustainable productivity improvements, such as the rollout of electronic signs.
Advertising leveraged in 2010 as we intentionally grew this expense less than sales. We continue to modify our media mix to utilize the most cost effective
methods. In 2010, we increased direct mail and digital marketing efforts and decreased print media. Preopening expenses leveraged in 2010 as we opened fewer
stores. Additionally, a significant number of the stores which opened in 2009 were leased stores which had higher rent expenses during the preopening period.
Information services expenses increased as a percentage of net sales, or “deleveraged,” in 2010, primarily due to planned incremental investments in technology
and infrastructure related to our E-Commerce business. Distribution costs, which are included in SG&A, totaled $187 million for 2010, $168 million for
2009 and $166 million for 2008.
Net revenues from the credit card program also deleveraged in 2010 due to reductions in late fee revenue as a result of legislative changes. In connection
with the April 2006 sale of our proprietary credit card accounts to JPMorgan Chase & Co. (“JPMorgan Chase”), we entered into a service and revenue-sharing
agreement. Pursuant to this agreement, JPMorgan Chase issues Kohl’s branded private label credit cards to new and existing Kohl’s customers. Since we do
not own the receivables, the receivables and the related allowance for bad debt reserve are not reported on our balance sheets. Risk-management decisions are
jointly managed by JPMorgan Chase and us. We handle all customer service functions and are responsible for all advertising and marketing related to credit
card customers and the majority of the associated expenses. Net revenues of the program are shared with JPMorgan Chase according to a fixed percentage and
are settled monthly. Net revenues include finance charge and late fee revenues, less write-offs of uncollectible accounts and other expenses.
In August 2010, we entered into a Private Label Credit Card Program Agreement with Capital One, National Association (“Capital One”), which will be
effective upon transition of the outstanding receivables from JPMorgan Chase to Capital One. We currently expect this transition to happen in the first fiscal
quarter of 2011. Kohl’s and Capital One will share in the net risk-adjusted revenue of the portfolio as defined by the sum of finance charges, late fees and
other revenue less write-offs of uncollectible accounts. Changes in funding costs related to interest rate fluctuations will be shared similar to the revenue.
Though management currently believes that increases in funding costs will be largely offset by increases in finance charge revenue, increases in funding costs
could adversely impact the profitability of this program.
SG&A for 2009 increased $218 million, or 5.5%, over 2008. SG&A increased primarily due to store growth and increased incentive compensation
and changes made to our non-management compensation structure.
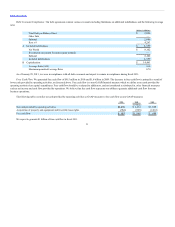
Depreciation and amortization $590 $541
The increases in depreciation and amortization are primarily due to the addition of new stores and remodels.
Operating income $1,712 $1,536
As a percent of net sales 10.0% 9.4%
25