McDonalds 2014 Annual Report Download - page 16
Download and view the complete annual report
Please find page 16 of the 2014 McDonalds annual report below. You can navigate through the pages in the report by either clicking on the pages listed below, or by using the keyword search tool below to find specific information within the annual report.-
 1
1 -
2
-
3
-
4
-
5
-
 6
6 -
 7
7 -
 8
8 -
 9
9 -
 10
10 -
 11
11 -
 12
12 -
 13
13 -
 14
14 -
 15
15 -
 16
16 -
 17
17 -
 18
18 -
 19
19 -
 20
20 -
 21
21 -
 22
22 -
 23
23 -
 24
24 -
 25
25 -
 26
26 -
27
-
28
-
29
-
30
-
31
-
32
-
33
-
34
-
35
-
36
-
37
-
38
-
39
-
40
-
41
-
42
-
43
-
44
-
45
-
46
-
47
-
48
-
49
-
50
-
51
-
52
-
53
-
54
-
55
-
56
-
57
-
58
-
59
-
60
-
61
-
62
-
63
-
64
 |
 |

10 McDonald’s Corporation 2014 Annual Report
PART II
ITEM 5. Market for Registrant’s Common Equity, Related Shareholder Matters and Issuer Purchases of
Equity Securities
MARKET INFORMATION AND DIVIDEND POLICY
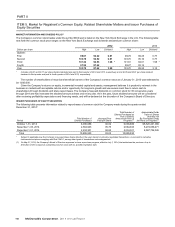
The Company’s common stock trades under the symbol MCD and is listed on the New York Stock Exchange in the U.S. The following table
sets forth the common stock price ranges on the New York Stock Exchange and dividends declared per common share:
2014 2013
Dollars per share High Low Dividend High Low Dividend
Quarter:
First 99.07 92.22 0.81 99.78 89.25 0.77
Second 103.78 96.52 0.81 103.70 95.16 0.77
Third 101.36 90.53 1.66 * 101.81 94.01 1.58 *
Fourth 97.50 87.62 99.27 93.14
Year 103.78 87.62 3.28 103.70 89.25 3.12
* Includes a $0.81 and $0.77 per share dividend declared and paid in third quarter of 2014 and 2013, respectively, and a $0.85 and $0.81 per share dividend
declared in third quarter and paid in fourth quarter of 2014 and 2013, respectively.
The number of shareholders of record and beneficial owners of the Company’s common stock as of January 31, 2015 was estimated to
be 1,663,000.
Given the Company’s returns on equity, incremental invested capital and assets, management believes it is prudent to reinvest in the
business in markets with acceptable returns and/or opportunity for long-term growth and use excess cash flow to return cash to
shareholders through dividends and share repurchases. The Company has paid dividends on common stock for 39 consecutive years
through 2014 and has increased the dividend amount at least once every year. As in the past, future dividend amounts will be considered
after reviewing profitability expectations and financing needs, and will be declared at the discretion of the Company’s Board of Directors.
ISSUER PURCHASES OF EQUITY SECURITIES
The following table presents information related to repurchases of common stock the Company made during the quarter ended
December 31, 2014*:
Period
Total Number of
Shares Purchased
Average Price
Paid per Share
Total Number of
Shares Purchased as
Part of Publicly
Announced Plans or
Programs(1)
Approximate Dollar
Value of Shares
that May Yet
Be Purchased Under
the Plans or Programs(1)
October 1-31, 2014 6,096,686 92.02 6,096,686 $ 8,520,241,086
November 1-30, 2014 2,564,943 95.75 2,564,943 8,274,656,471
December 1-31, 2014 2,234,301 92.62 2,234,301 8,067,726,045
Total 10,895,930 93.02 10,895,930
* Subject to applicable law, the Company may repurchase shares directly in the open market, in privately negotiated transactions, or pursuant to derivative
instruments and plans complying with Rule 10b5-1, among other types of transactions and arrangements.
(1) On May 21, 2014, the Company's Board of Directors approved a share repurchase program, effective July 1, 2014, that authorizes the purchase of up to
$10 billion of the Company's outstanding common stock with no specified expiration date.